Table of contents
- What Restaurant Inventory Management Actually Controls (and What It Doesn’t)
- Set Up Before You Count: Par Levels, Units of Measure, and a Consistent Sheet
- The Daily Count: What to Spot-Check and Why It Can’t Wait Until Week’s End
- The Weekly Full Count: A Step-by-Step Walk Through Your Kitchen
- Count to Usage Rate: The Math That Turns Numbers into Ordering Decisions
- Reading Variance the Morning After, Not the Month After
- Count to Order: How to Build a Purchase Order from Your Actual Numbers
- Where Restaurant Inventory Software Fits (and Where It Doesn’t Replace the Work)
- The Habit Loop: Making Weekly Inventory a Non-Negotiable Part of Your Operation
- Make Every Count Drive a Decision
- Frequently asked questions about restaurant inventory management
You're running food cost calculations at month-end and the number doesn’t match what you thought you spent. You dig in, and you can’t figure out where it went wrong. The count sheets look fine, the orders seem reasonable, but the math doesn’t close. That’s not a math problem. That’s a workflow problem.
This guide walks you through the actual day-to-day process: how to set up your counts, run them consistently, turn the numbers into a daily usage rate, read variance before it costs you, and build a purchase order from real data instead of habit. No software feature lists – though a restaurant pos system that feeds you clean sales data makes every step easier. Just the workflow.
Key Insights
- Your food cost percentage is only as accurate as your inventory count. A sloppy or inconsistent count produces a number you’ll make real financial decisions on and lose real money chasing.
- The count is the input; the daily usage rate is the output that actually drives ordering quantities, par level calibration, and variance investigation. Most independent operators stop at the count and never extract the decision.
- Variance investigated the morning after a count is a solvable puzzle with witnesses and receipts. Variance investigated 30 days later is an educated guess. Same-day follow-up is the single highest-leverage habit change in restaurant inventory management.
- A restaurant inventory spreadsheet can deliver 90% of what a paid app delivers for a single-location operator. The real gap is POS integration for automatic theoretical-usage calculations and standardized input forms when multiple staff members are counting on different days.
What Restaurant Inventory Management Actually Controls (and What It Doesn’t)
Inventory management is a closed loop: what you receive, what you use, and what you order. It is not a one-time count sheet exercise you run when the numbers look off.
That loop connects directly to your food cost percentage. The formula is:
(Beginning Inventory + Purchases − Ending Inventory) ÷ Total Sales × 100
Every variable in that formula depends on an accurate count. If your count is inconsistent, your food cost percentage is fiction. You’ll make real financial decisions based on it.
The three levers this loop actually controls:
- Food costs: what you’re spending relative to what you’re selling
- Food waste and shrinkage: product lost to spoilage, prep mistakes, or theft before it ever hits a plate
- Over-ordering: cash tied up in sitting inventory, product you don’t need yet expiring on a shelf before it’s used
Here’s what it doesn’t control: bad recipes and under-priced menu items. Reviewing your menu pricing is a separate exercise. Inventory management will surface those problems clearly. Fixing them is on you.
Set Up Before You Count: Par Levels, Units of Measure, and a Consistent Sheet
Par Levels Are Calculated, Not Guessed
A par level is the minimum on-hand quantity you need to get through your next ordering cycle without running out. To calculate a starting par:
Use four weeks of historical data to find your average weekly usage. Then: average weekly usage × order lead time in days ÷ 7, and add a 10–15% safety buffer.
Review your pars every four to six weeks. Seasons shift, menus change, and a par level set in February is wrong by May.
Standardize Units Before You Write Anything Down
Counting by the case when you order by the pound creates invisible, compounding errors. Decide on your unit of measure for every item before your first count and never change it mid-sheet.
Build Your Inventory List in Walk-Through Order
Your restaurant inventory list should follow the physical path through your kitchen:
- Walk-in proteins
- Walk-in dairy and produce
- Dry storage
- Bar inventory
Alphabetical order looks organized. Walk-through order saves time and prevents skipped sections.
Run Two Versions of the Sheet
- Count sheet (quantities only): for whoever is doing the counting, keeping them focused
- Costed version: for the owner, keeping the financial picture honest and separate
FIFO Before the Count Starts
Label shelves so the oldest product is always at the front. If your sheet says 8 lbs of salmon but 3 lbs is buried behind the new delivery, your count is wrong before you start. First in, first out (FIFO) isn’t just a food safety practice. It’s an inventory accuracy practice, and it helps you track shelf life so you honor expiration dates and reduce spoilage before product ever reaches the prep line.
The Daily Count: What to Spot-Check and Why It Can’t Wait Until Week’s End
Daily inventory counts are not full counts. They are targeted spot-checks on the 8–12 items that drive your food cost or run out fastest: proteins, prepped components, key bar pours.
Assign Ownership to a Specific Role
The closing line cook or prep cook runs the spot-check as part of shift close, not the manager as an add-on task. Add-on tasks don’t survive a busy Friday.
Train for Consistency
Two different people counting the same shelf should land within 5% of each other. That requires the same sequence, the same unit of measure, and the same time of shift every time. Consistency is the skill. The count sheet is just the tool.
Use the Daily Number as a Trigger
If you’re at par on a key protein Wednesday and your delivery is Friday, you need to know Tuesday night, not Thursday morning when it’s too late to adjust the order.
Keep the Format Under Five Minutes
Item | Unit | Counted Quantity | Par | Flag if Below Par
Anything longer stops happening on busy nights.
The Mistake Worth Naming
Skipping the count on slow nights because “it doesn’t matter.” Slow nights are exactly when over-portioning, waste, and theft go unchecked. The count matters most when no one is watching.

The Weekly Full Count: A Step-by-Step Walk Through Your Kitchen
Schedule your weekly count on the same day every week, before your major delivery arrives. You want to count actual on-hand stock levels, not a mix of old and new product.
Two-Person Count for Accuracy
One person calls quantities, one records. Swap roles at the midpoint to catch each other’s counting patterns before they become habits.
Counting Sequence
Walk-in proteins, walk-in dairy, walk-in produce, dry storage, shelf-stable dry goods, bar. This sequence minimizes re-opening cooler doors and re-walking the same areas.
Partial Containers Must Be Measured
“Some” and “a lot” are not units. Weigh or measure partial containers with a consistent visual fraction. An inconsistent partial is where most weekly counts fall apart.
Enter Numbers Immediately
Log your count before any other task. Counts reconstructed from memory two hours later are estimates, not data.
Post-Count Reconciliation
Beginning Inventory + Deliveries Received − Ending Count = Total Usage for the week
Cross-check that figure against your POS sales data for the same period. That comparison is where the real information lives.
Count to Usage Rate: The Math That Turns Numbers into Ordering Decisions
Actual Usage vs. Theoretical Usage
Actual usage: Beginning Inventory + Received Deliveries − Ending Count = what you truly went through
Theoretical usage: Sum of (each menu item sold × recipe yield per ingredient unit), pulled from your POS sales data, representing what you should have used
Worked example:
You started the week with 20 lbs of chicken breast, received a 30 lb delivery, and ended with 12 lbs on hand.
Actual Usage = 20 + 30 − 12 = 38 lbs
POS shows dishes that required 34 lbs (theoretical)
Gap = 4 lbs unaccounted
Convert to a Daily Usage Rate
38 lbs ÷ 7 days = 5.4 lbs per day
That daily rate is the number your ordering math runs on from here forward. The count tells you where you are today. The usage rate tells you how fast you’re moving and whether your par levels match your actual business.
Flag any item where actual usage consistently exceeds theoretical by more than 3–5%. That gap is a food cost problem with a specific cause (waste, over-portioning, or shrinkage) and it will not close on its own – closing it is part of running tight day-to-day restaurant operations.
Reading Variance the Morning After, Not the Month After
Variance = Actual Usage − Theoretical Usage
A positive number means you used more than you sold, which is a cost problem with a cause. A negative number usually means a counting problem.
The Three-Question Diagnostic
Run this at the line level the morning after the count:
- Did we sell it? Check the POS for high-volume service, comp-heavy nights, or family-meal events.
- Did we waste it? Check the waste log for prep mistakes, drops, or product that expired before service.
- Did someone take it? Check your access log and talk to the team.
Investigating variance 30 days after the fact is like investigating a car accident after the scene has been cleared. Same-day or next-morning reviews give you witnesses, receipts, and actual memory of that service.
Build a Simple Variance Log
After four weeks, patterns become impossible to ignore.
Acceptable Thresholds
For most independent operators, 3–7% on food cost variance is workable. Consistently above that signals something structural. Frame variance investigation as a numbers puzzle, not a personnel inquisition. If your team thinks high variance leads to blame, they’ll start giving you numbers they think you want to see.
Count to Order: How to Build a Purchase Order from Your Actual Numbers
The Order Quantity Formula
(Daily Usage Rate × Days Until Next Delivery) + Par Buffer − Current On-Hand = Order Quantity
Continuing the chicken breast example:
Daily rate: 5.4 lbs/day | Next delivery in 3 days | Par buffer: 8 lbs | Current on-hand: 12 lbs
Order = (5.4 × 3) + 8 − 12 = 16.2 + 8 − 12 = 12.2 lbs, rounded up to 13 lbs
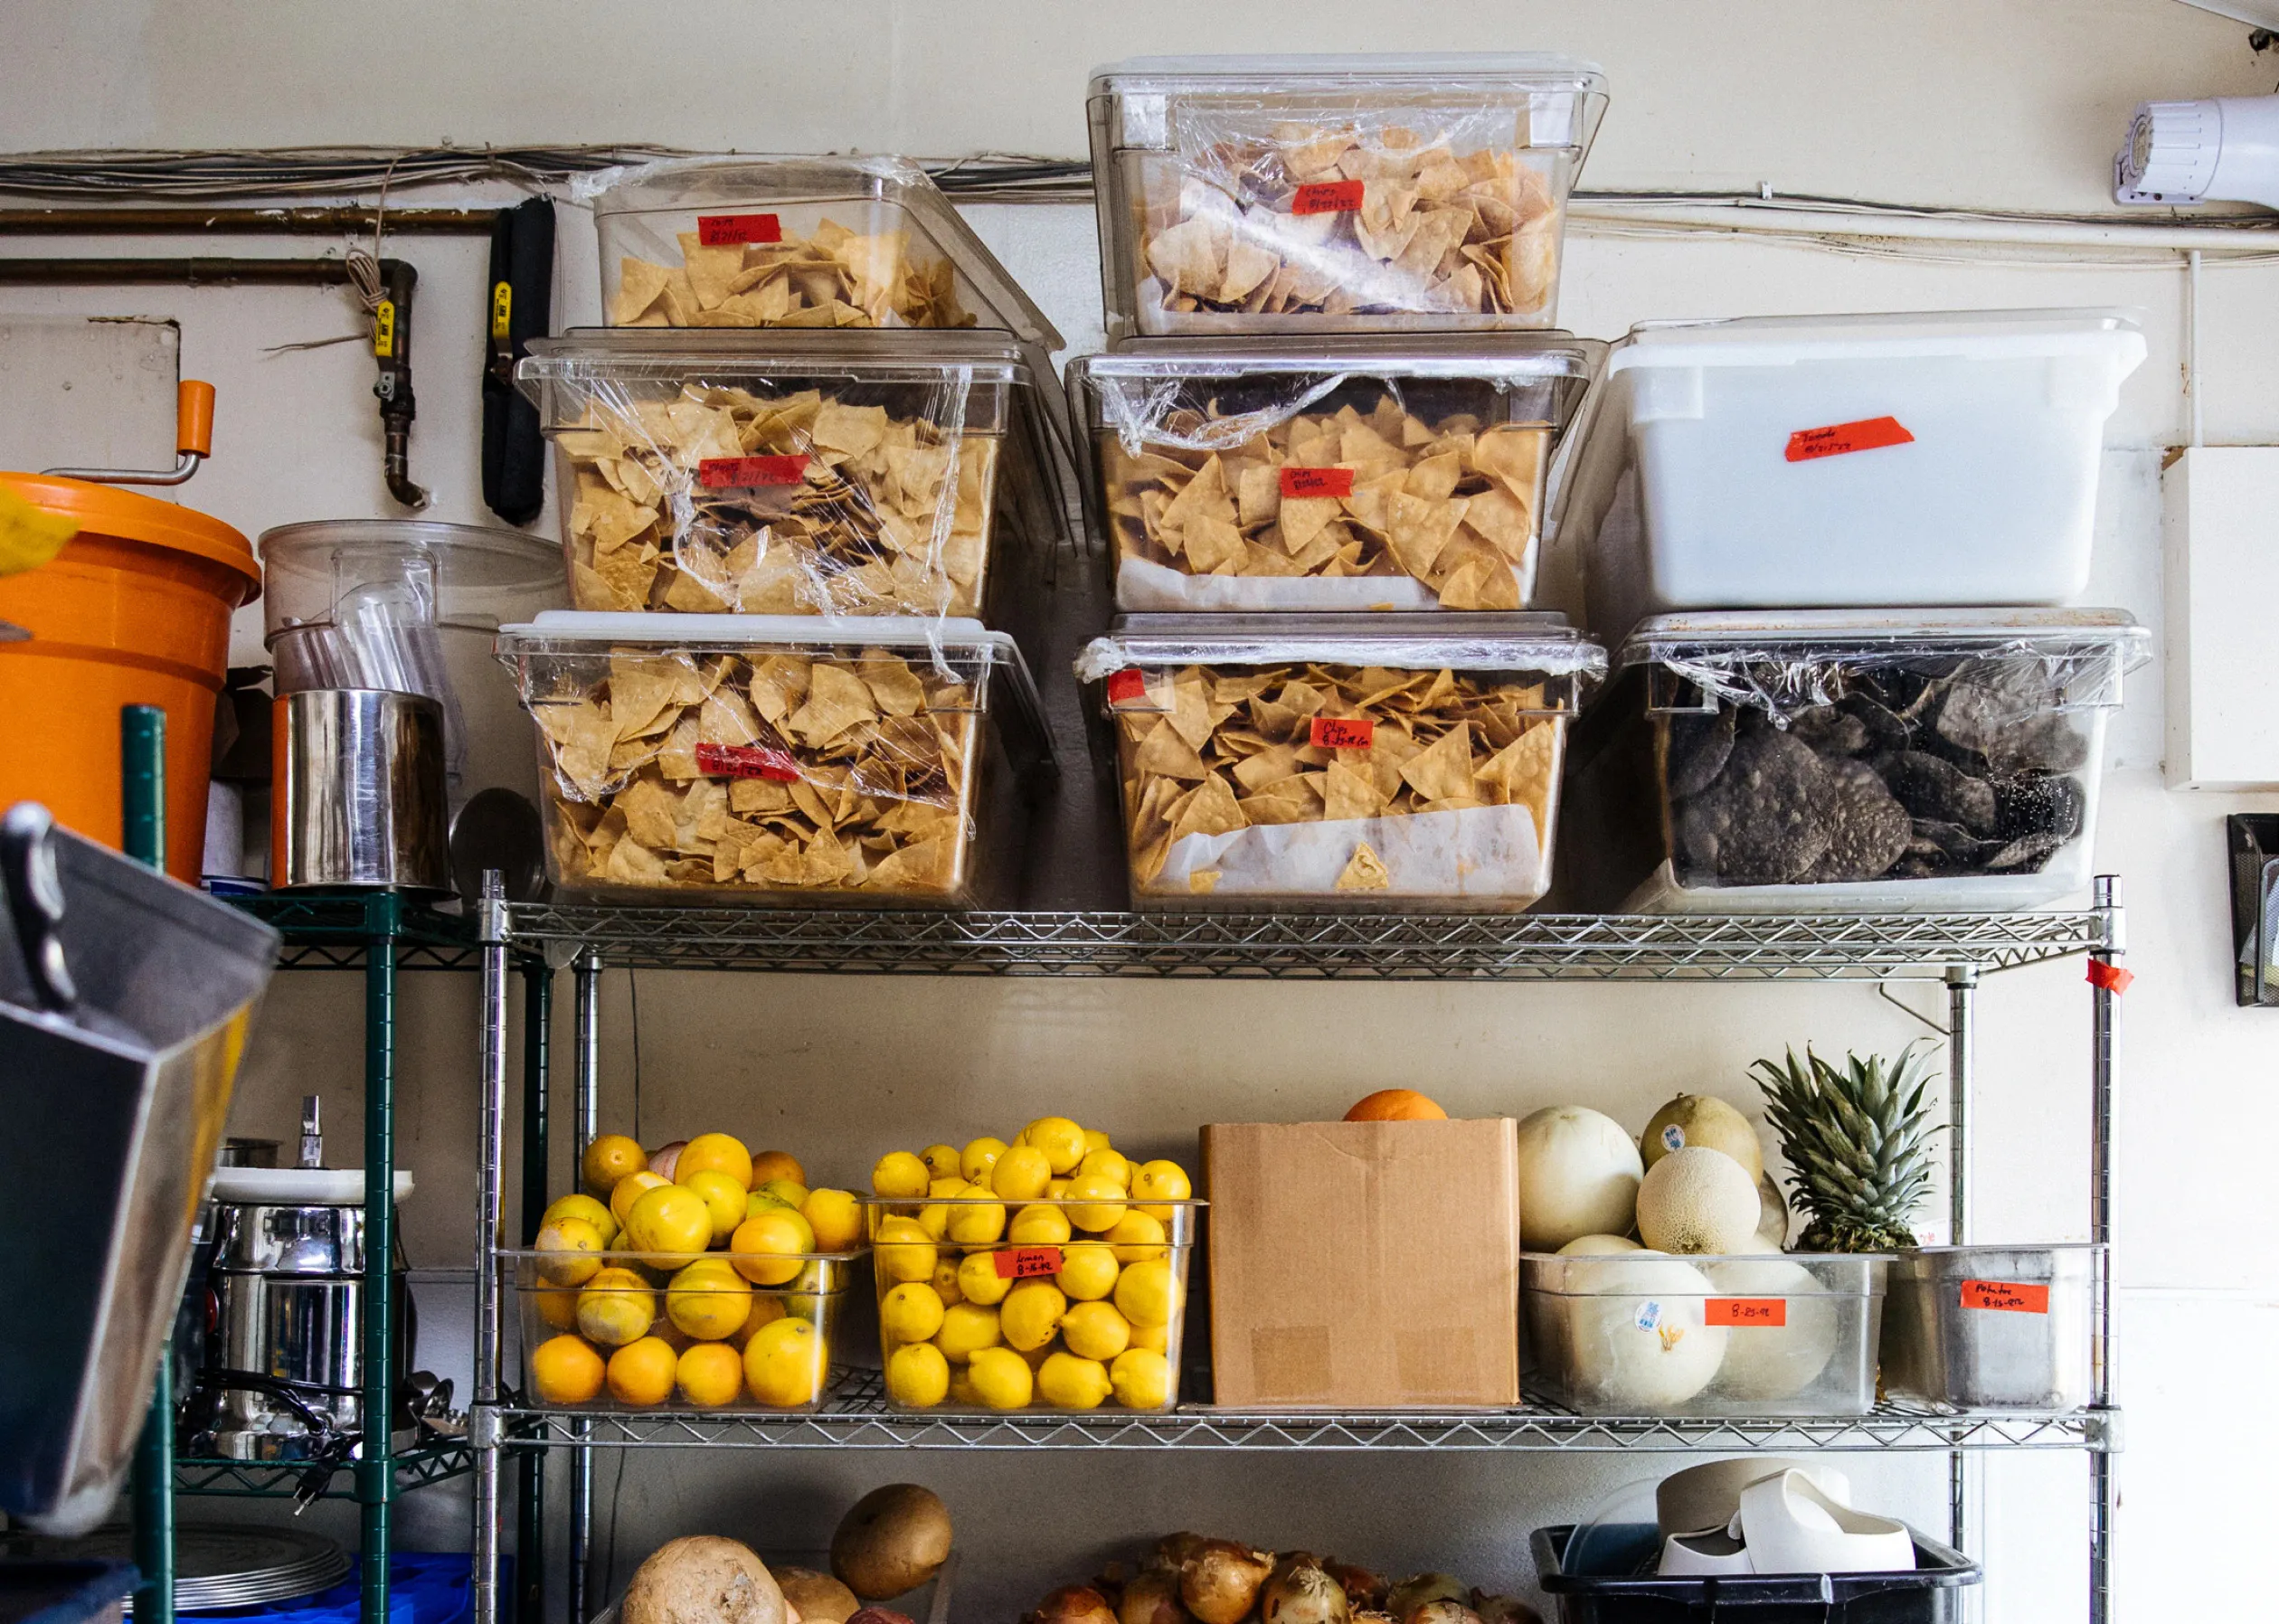
That’s a defensible number, not a guess. Tighter ordering also protects cash flow directly: every pound you don’t over-order is cash that stays liquid instead of expiring on a shelf, and it protects your profit margins every single week.
Adjust for Known Demand Spikes
Before finalizing any purchase order, account for an upcoming weekend, catering event, or holiday. Multiply your daily rate by an event factor (1.20–1.30× is a reasonable starting point) and recalculate. Using forecasting to account for known demand shifts is one of the fastest ways to bring order quantities in line with actual need and reduce food waste.
Cross-Check Distributor Minimums
If your math says 13 lbs but the supplier minimum is 20 lbs, you have a decision to make: adjust the order or negotiate the minimum. Don’t silently add 7 lbs you don’t need. Strong vendor management means having this conversation with your distributor directly rather than absorbing the overage every week.
Final Check Before Submitting
Scan your ending inventory for items running significantly above par. If you counted 22 lbs of chicken on hand and your 7-day usage is only 38 lbs, you likely don’t need to order chicken this week. Reviewing your order guides before submission catches these situations before you commit.
Operators who reorder “what we usually get” are the ones chronically over-ordering perishables and tying up cash in product that expires before it’s needed.
Where Restaurant Inventory Software Fits (and Where It Doesn’t Replace the Work)
What a Restaurant Inventory Management System Actually Automates
- Pulls POS sales data to calculate theoretical usage without a separate spreadsheet
- Enables real-time inventory tracking: stock levels update after every logged delivery
- Generates purchase orders from pars rather than manual math, eliminating manual data entry errors that compound weekly
- Flags variance above a set threshold automatically
- Supports recipe costing by linking ingredient costs to menu items so theoretical usage calculates without a separate spreadsheet
Restaurant inventory management software also supports inventory turnover analysis, giving you a clear picture of which items are moving and which are creating cost drag across your inventory levels.
What Still Requires Human Judgment
- The physical count: someone still has to look at the shelf
- Diagnosing the cause of variance
- Adjusting par levels after a seasonal demand shift
- Managing supplier relationships and price negotiation
Where Otter Fits In
Otter Analytics connects your sales data, order data, and operational metrics into a single dashboard, so the outputs from your inventory count feed directly into the performance numbers you’re already watching. Use it to track product mix, identify which items are driving food costs, and spot inventory trends without reconciling multiple reports. It’s also integrated with MarketMan and other popular inventory tools, so data from your POS flows seamlessly to them.
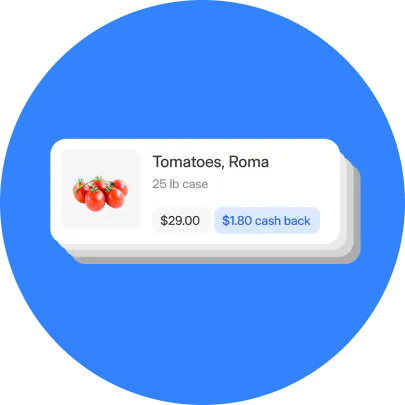
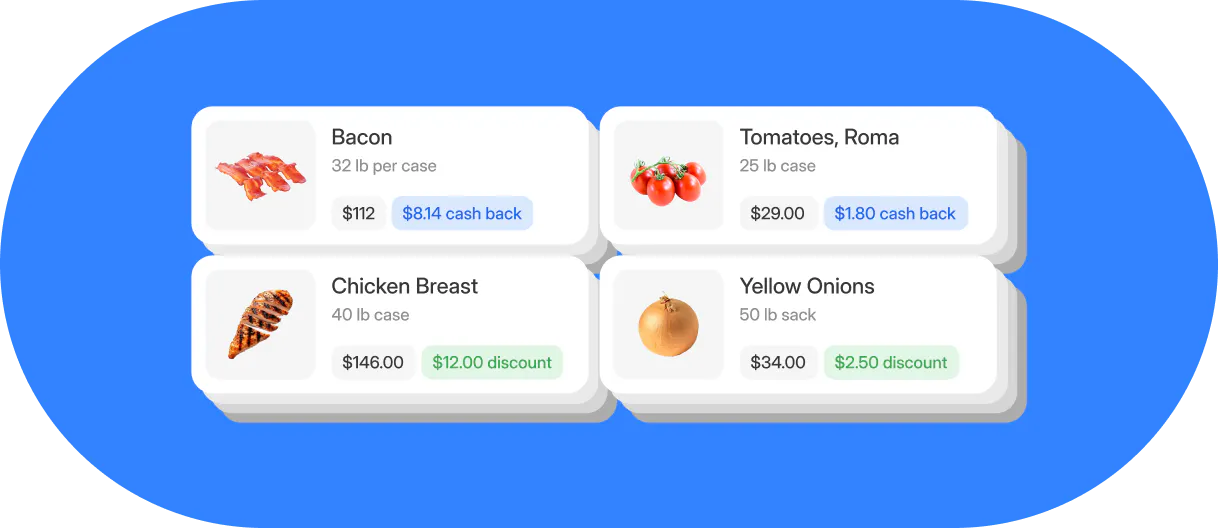
Otter Inventory Savings works with your existing supply chain and distributor relationships to unlock discounts at checkout, cash back on food purchases you’re already making, and sourcing recommendations when a same-quality ingredient is available at a lower price, all without switching suppliers or changing how you order.
“I like your guys’ reporting. Specifically the product mix report: it tells us what we’ve sold the most for the day, to the least. We got Otter back in May, and since then we’ve cut out three items that were really just costing us money to have on the menu. I feel that has been beneficial.”
Nicole Kuti, Co-owner, Telly’s Charburgers (Santa Clarita, CA)
Spreadsheet vs. App: The Honest Comparison
A restaurant inventory spreadsheet is a legitimate starting point for a single-location operator with fewer than 80 SKUs. A well-structured Google Shal data entry errors when multiple people fill it in on different days.
A restaurant inventory app earns its monthly cost when you have more than one location, your SKU count exceeds 80 items, or counts are done by rotating staff. App-based count forms standardize the unit of measure and reduce transcription errors that compound weekly.
Automated inventory management through a restaurant inventory system connected to your POS coeet covering beginning inventory, deliveries, and ending count captures 90% of the discipline. The main limitations: no live POS integration for automatic theoretical-usage calculations, and compounding manumpares what you sold (theoretical) against what you actually used (physical count) in one automated report. Without it, you’re manually reconciling two separate documents and introducing errors at every merge.
The Habit Loop: Making Weekly Inventory a Non-Negotiable Part of Your Operation
Inventory management is the foundation of cost control in any restaurant, but it only works as a system when it happens on a fixed schedule. Ad hoc counts produce ad hoc results you cannot trend or act on confidently.
Tie the weekly count to an existing anchor. Your main delivery day is typically the best trigger. Count before the delivery arrives, log it, then reconcile after the delivery is put away and labeled.
Cross-train at least two people on the full count procedure. If only you can do it, it won’t happen the week you’re sick, on vacation, or dealing with an equipment failure mid-service.
Run the weekly debrief as a 10-minute conversation: What were the top three variance items this week? What did we do about each? What do we need to watch next week?
Track food cost percentage weekly, not monthly. If you’re waiting 30 days to see the number, you’re 30 days late to fix what caused it. Weekly data gives you four correction opportunities in the time a monthly report gives you one.
For independent operators who implement consistent weekly inventory with honest variance follow-up, food cost percentage typically drops 1–3 points within 60 days. At $50,000 in monthly revenue, one percentage point is $500 a month in recovered margin, which compounds directly into profit margins every month you stay disciplined.
Make Every Count Drive a Decision
The count-to-order workflow is five connected steps: set your pars, run daily spot-checks, do a full weekly count, calculate your usage rate, and build every purchase order from that rate. Each step feeds the next. Skip one and the whole loop produces noise instead of signal.
The cost of goods sold (COGS) number on your P&L is only as honest as the inventory data behind it – the same goes for your restaurant bookkeeping as a whole. Get the workflow right and the number becomes something you can manage and improve, with a direct impact on your profit margins every single week.
Want to see what your count data looks like when it’s connected to your sales automatically? Book a demo with Otter and stop reconciling two spreadsheets for good.
Frequently asked questions about restaurant inventory management
How often should a restaurant do a full inventory count?
Weekly is the operational standard for independent restaurants that want actionable data. Pair it with daily spot-checks on your highest-cost or fastest-moving items: proteins, key prep components, top bar pours. Monthly full counts tell you what happened over a period you can no longer fix. Weekly counts tell you what is happening in time to act on it.
What is the difference between a physical count and perpetual inventory tracking?
A physical count is a manual walk-through of what is on the shelf right now. Perpetual inventory tracking is a running tally updated every time you receive a delivery or ring a sale. Most independent restaurants use weekly physical counts as the source of truth and use POS sales data to estimate usage between counts. A restaurant inventory system that integrates with your POS can automate the perpetual side, enabling real-time inventory tracking that updates inventory levels as you sell without a mid-week manual re-count.
What is a par level and how do I calculate one for my restaurant?
A par level is the minimum quantity you need on hand to get through your next ordering cycle without running out. To calculate a starting par: find your average daily usage for the item over the last four weeks, multiply by the number of days between your orders, then add a 10–15% safety buffer for unexpected demand. Revisit your pars every four to six weeks as your season and menu change.
How do I calculate food cost percentage using my inventory counts?
Food cost percentage = (Beginning Inventory + Purchases − Ending Inventory) ÷ Total Sales × 100. It’s one of the core numbers in restaurant accounting. Run this every week once your counts are consistent. Most full-service independent restaurants target 28–35%. Quick-service and counter-service operations often run 25–31%. If your number is running above target, your weekly variance report is where you start looking for the cause.
What should be on a restaurant inventory list?
Every item you order and use, organized by storage location in the order your kitchen is physically laid out: walk-in proteins, walk-in dairy and produce, dry storage, bar inventory. Each line needs item name, unit of measure, par level, and space for the counted quantity. A count sheet organized in walk-through order means the counter never backtracks and never skips a section.
Can I manage restaurant inventory with a spreadsheet, or do I need dedicated software?
A well-structured spreadsheet handles the core discipline reliably for most single-location operators: beginning inventory, deliveries logged, ending count, usage calculated. The limitations appear when multiple people are filling in the same sheet on different days (transcription errors compound fast), when you exceed roughly 80 SKUs, or when you want automatic POS integration to generate theoretical usage without a manual merge. A restaurant inventory app earns its monthly cost at that threshold.
What causes the gap between my actual and theoretical food cost?
Three sources cover the vast majority of cases: waste (prep mistakes, spoilage, plate drops), over-portioning (staff not using consistent portion sizes), and theft. Run your variance analysis by individual item rather than overall. A 6% aggregate variance might be one protein or one bar spirit driving nearly all of it. Investigate within 24 hours of the count while the cause is still traceable to a specific shift or service.
How does a restaurant inventory system connect to my POS?
A restaurant inventory management system with a POS integration pulls your sales data automatically to calculate how much of each ingredient you theoretically should have used based on what you sold – whether orders come in through staff or a restaurant kiosk system. You enter your physical count, and the system computes the variance (actual usage minus theoretical usage) without a separate spreadsheet comparison. The integration also means your inventory levels update as you sell, supporting real-time inventory control so you can see stock levels mid-week without a full re-count.

Book a demo to see how Otter’s all-in-one platform can help your restaurant thrive.