Table of contents
- Why restaurant inventory works differently from other industries
- 1. FIFO: first in, first out
- 2. ABC analysis
- 3. Cycle counts
- 4. The perpetual inventory system
- 5. Reorder points and safety stock
- 6. Just-in-time inventory
- 7. Demand forecasting
- 8. Economic order quantity
- The purchasing layer most restaurant operators haven't tapped
- What separates restaurants that control food cost from those that track it after the fact
- Frequently asked questions about inventory management techniques
Most content about inventory management techniques is written for warehouses and e-commerce. The principles are real, but the application looks different in a restaurant kitchen. You are not managing finished goods on stable shelves. You are managing perishable goods with 3-7 day windows, prep items that expire faster, and a demand curve that swings hard between Monday lunch and Friday dinner.
The eight techniques below translate directly to restaurant operations. Some are foundational. Some require software. All of them reduce food cost when applied consistently, and none of them require a logistics degree to implement.
Why restaurant inventory works differently from other industries
Retail and warehouse operations deal with raw materials and finished goods that can sit for weeks or months. Restaurants work with perishable goods where spoilage is the default outcome if inventory control fails. You cannot hold excess chicken breast the way a retailer holds excess denim. It turns into a COGS write-off by Thursday.
A few other restaurant-specific realities that shape how these techniques apply:
Demand swings by daypart, not just day.
Friday dinner can require 3x the protein prep of Monday lunch. Inventory management strategies built on weekly averages miss the peaks that cause stockouts mid-service
Inventory shrinkage is constant and silent.
Portioning drift, untracked staff meals, comp drinks, and trim waste erode your inventory accuracy without ever appearing on a report unless you track them deliberately
Lead time from distributors is rarely zero.
Supply chain disruptions, delivery windows, and minimum order quantity (MOQ) requirements mean you can't simply order what you need the moment you need it
Warehouse space is your walk-in, dry storage, and freezer.
Warehouse management in a restaurant means controlling three physical spaces rather than one facility. Holding costs are measured in spoilage, not warehouse fees
Understanding these differences is what separates useful inventory management strategies from generic ones. The techniques below are built around them.
1. FIFO: first in, first out
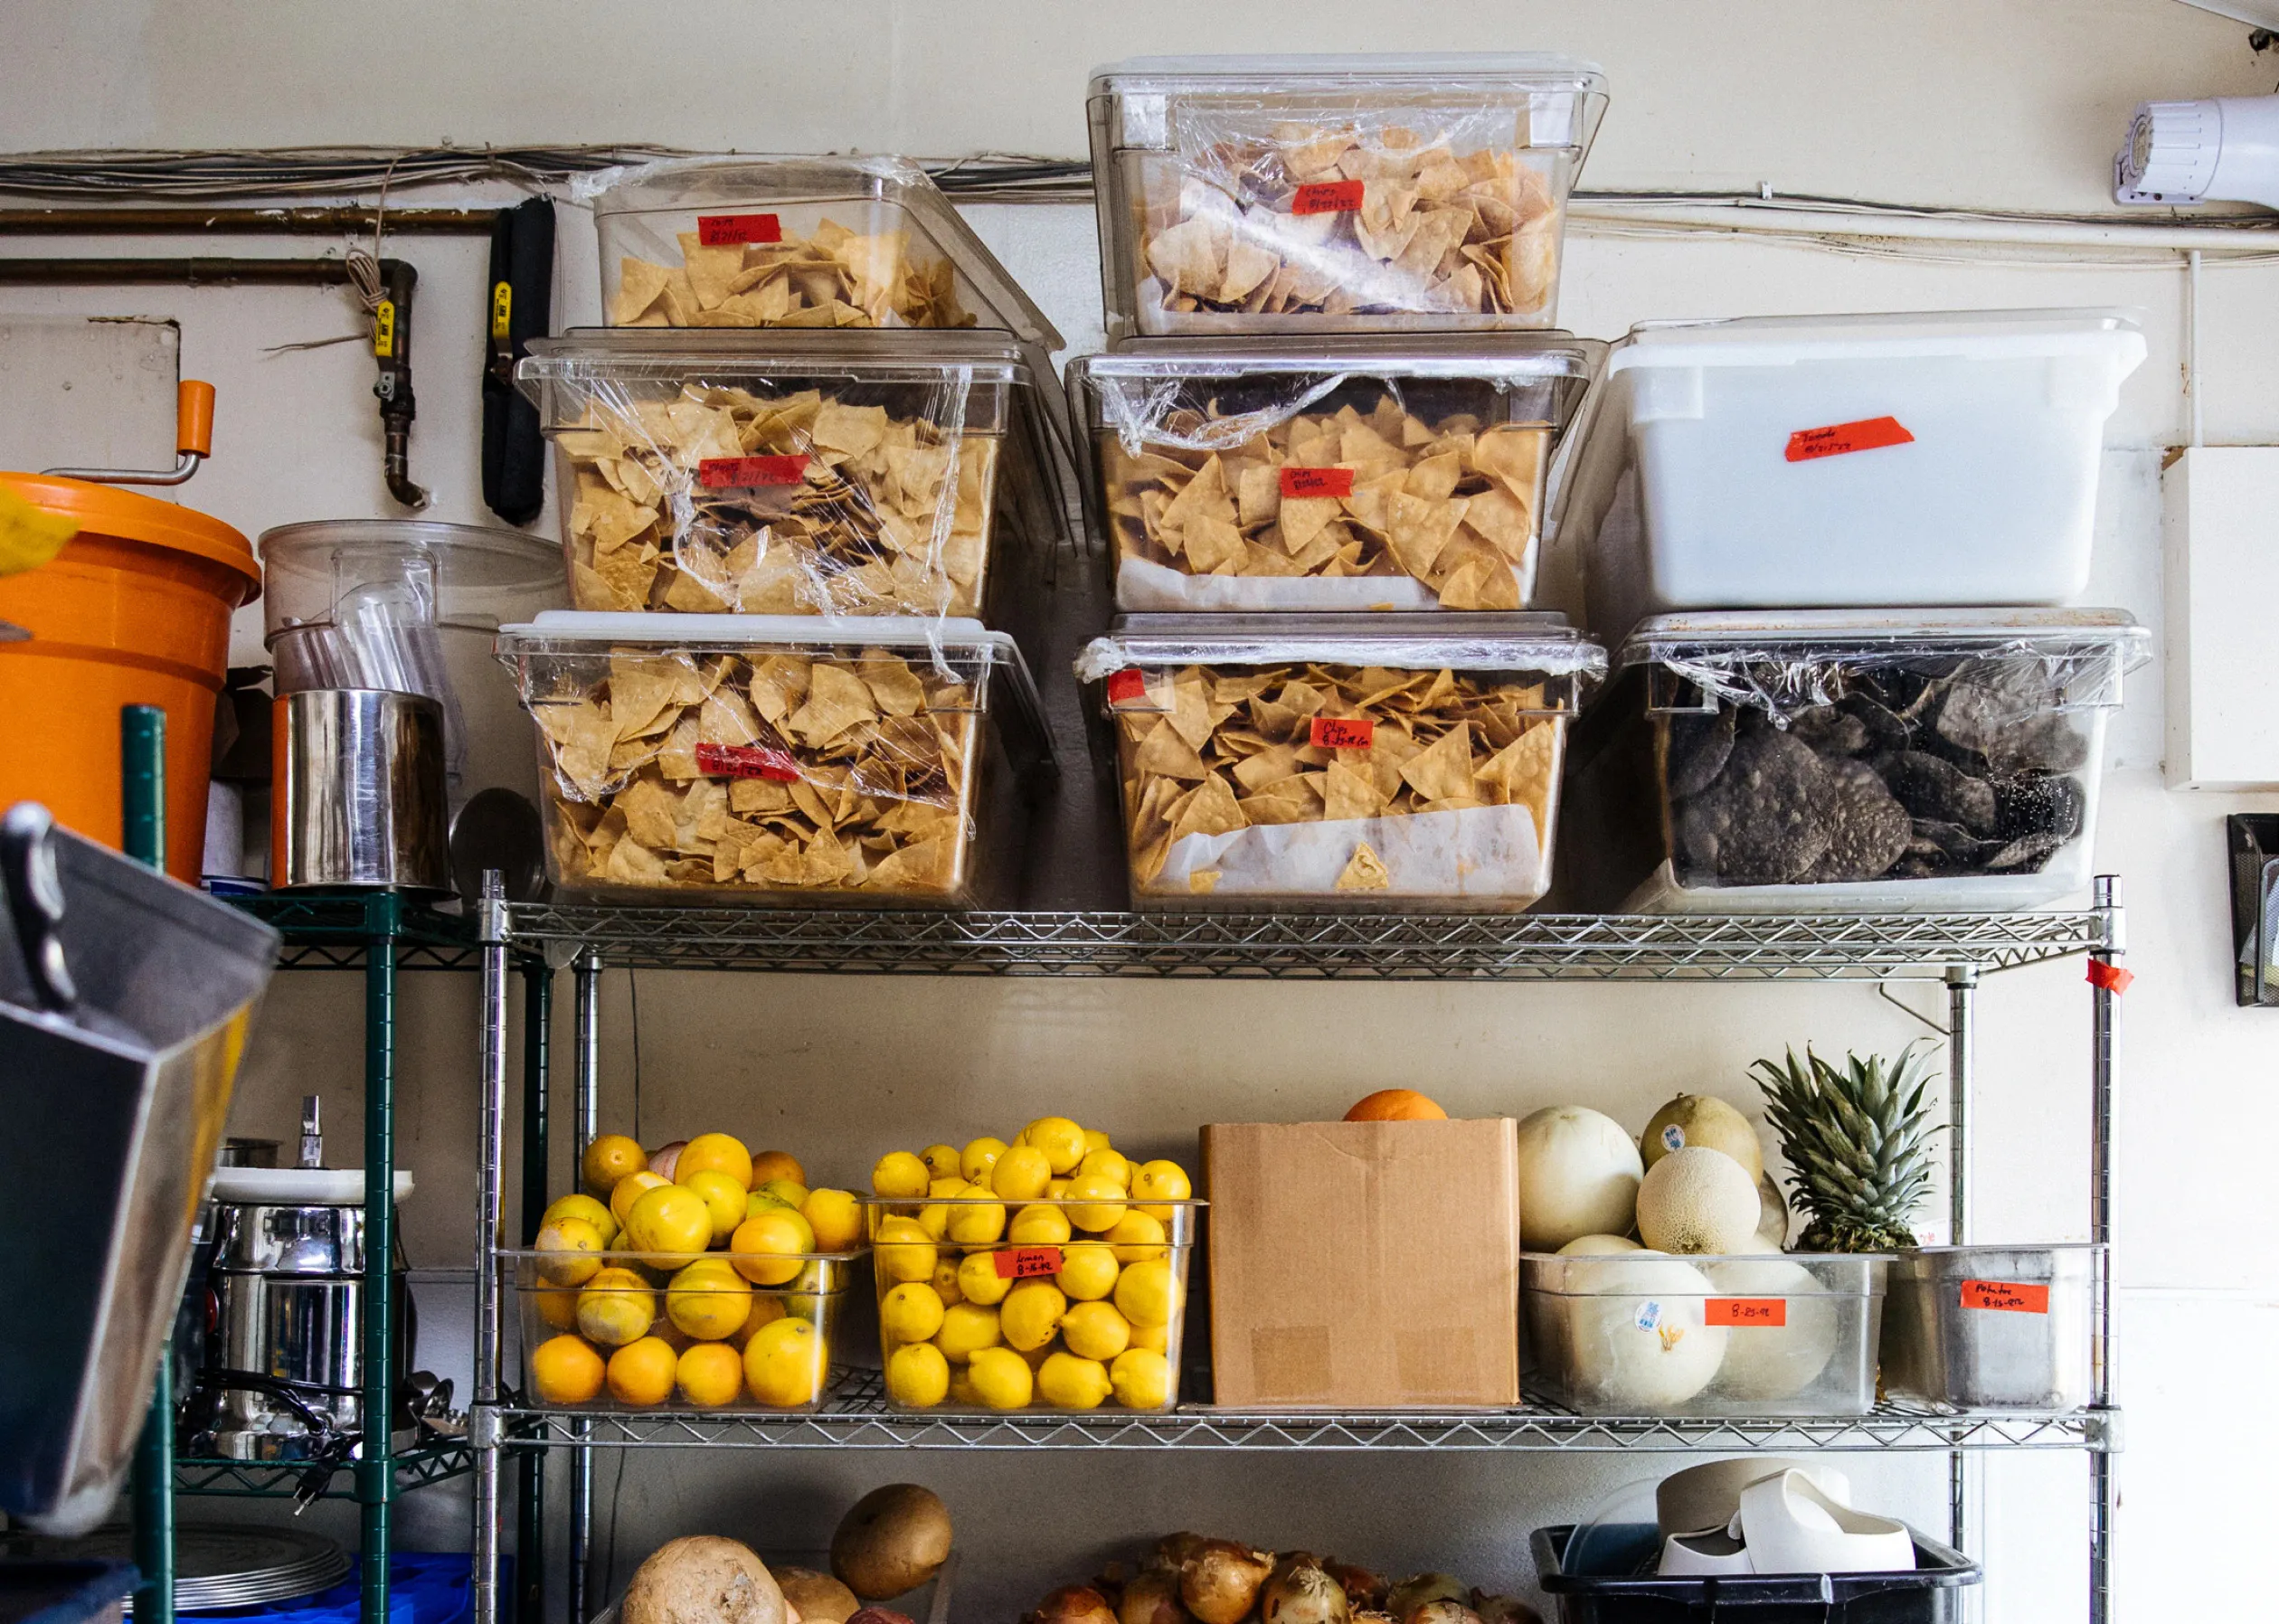
FIFO (first in, first out, also written as first-in, first-out) is the most fundamental inventory control technique in food service and the one most consistently violated during a busy receiving shift. The principle: the first inventory received gets used first. Items that arrived Monday get pulled before items that arrived Wednesday, even if Wednesday's delivery is stacked in front.
FIFO applies to every category of perishable goods: raw proteins, produce, dairy, prepped mise en place, and even finished goods like baked items or prepped sauces. A practical restaurant application of FIFO requires:
- Dating every item at receiving, either with a label or by writing directly on the container
- Storing new deliveries behind or beneath existing stock, not in front of it
- Using batch tracking for high-value proteins so you know exactly which cut arrived on which day and in which position in your walk-in
The contrast to FIFO is LIFO (last in, first out), the last-in, first-out method where the most recently received inventory gets used first. LIFO is more common in shelf-stable retail contexts and for inventory valuation purposes. In a restaurant kitchen, LIFO creates spoilage. A FIFO system, consistently applied, eliminates the "found expired product in the back of the walk-in" problem entirely.
Barcode scanning and inventory management software with SKU-level tracking make FIFO compliance easier to enforce, especially in higher-volume operations where manual dating and rotation is harder to sustain across shift changes.
2. ABC analysis
ABC analysis is an inventory management technique that classifies your inventory into three tiers based on value and usage frequency, then applies different counting and control standards to each tier.
- A items: High-value, high-usage items that represent the majority of your cost of goods sold. In a restaurant, this is typically proteins and specialty ingredients. Count these daily or every other day. Tight inventory accuracy on A items is where food cost is won or lost
- B items: Moderate value and usage. Produce, dairy, and batch-prepared sauces typically fall here. Count weekly
- C items: Low-cost, high-volume items like dry goods, disposables, and spices. Count monthly. Dead stock accumulates most often in C items: specialty dry goods purchased for a limited menu, items ordered in bulk that saw lower-than-expected usage
ABC analysis improves carrying costs management by concentrating your team's energy where the financial exposure is highest. It also gives you a framework to measure inventory turnover by tier: A items should move fast; slow-moving A items are a pricing or portioning problem worth investigating. Counting everything at the same frequency is how inventory audits burn out kitchen managers and stop happening consistently. Tiering by cost exposure keeps counts manageable and meaningful.
One nuance for restaurants: an item can be a C item by unit cost but an A item by daily volume. High-volume, low-cost items like cooking oil can drive significant variance if not tracked. Let usage rate inform the tier as much as unit cost.
3. Cycle counts
A full physical inventory count done once a month gives you one data point per month. Cycle counts replace that single big count with rolling partial counts done daily or weekly, rotating through different categories on a set schedule until the full inventory has been counted over a period of days or weeks.
The advantage over periodic full counts: errors surface faster, before they compound into a month's worth of untracked variance. If your proteins are off by 15% on Wednesday, you find out on Wednesday, not on the 31st.
A practical cycle count schedule for a restaurant:
- Monday: proteins and high-shrinkage perishable goods (A items)
- Wednesday: produce and dairy
- Friday: dry goods and packaging
- Monthly: freezer inventory and low-velocity C items
Cycle counts improve inventory accuracy systematically and make the data usable for ordering decisions in near-real time. Combined with a perpetual inventory management system, cycle count results update on-hand quantities automatically rather than requiring a manual reconciliation at month-end.
The logistics are simple: a standardized count sheet organized by storage location (walk-in first, dry storage second, freezer last), a consistent counting method (always count from top shelf to bottom, always left to right), and a designated person per area. Consistency in method is what makes cycle counts comparable period over period.
4. The perpetual inventory system
A perpetual inventory system provides real-time inventory tracking, updating on-hand quantities automatically as sales occur and purchases are received. The alternative is a periodic inventory system, which only updates counts when a physical count is performed.
In a restaurant context, a perpetual inventory system connected to your point of sale (POS) means that every menu item sold automatically deducts the corresponding ingredients from theoretical on-hand quantities. A cheeseburger sold deducts the patty, the bun, the cheese, and the lettuce from inventory. You don't have to wait for Friday's count to know you're running low on brioche buns.
The business case for perpetual over periodic: ordering decisions based on actual sales data rather than memory or gut feel. Reorder points trigger automatically when an ingredient drops below its set threshold. The gap between theoretical usage (what the system says you should have used based on sales) and actual on-hand quantity (what you count physically) is your shrinkage and variance number, visible on demand rather than discovered at month-end.
Perpetual inventory management requires an inventory management system integrated with your POS. Without that integration, you're running a manual reconciliation every time you want a current on-hand figure, which is slow enough that most operators don't do it consistently.
Christina Hong, owner of Seoulmates in Beverly Grove, Los Angeles, uses the Otter Go app to monitor inventory status in real time even when she's off-site. "I found one of the things very useful as the business owner, especially when I'm not here, is that my staff can 86 menu items if we run out of an ingredient. Through the Otter Go app, it gives me a notification and lets me know that something went unavailable, so I can check in and see why. That's been really helpful."
That's a perpetual inventory system working as intended: the moment stock hits zero, the system flags it rather than waiting for a count to surface the problem.
5. Reorder points and safety stock
A reorder point is the on-hand quantity at which you place a new order for an ingredient, timed so the new delivery arrives before you run out. Safety stock is the buffer quantity held above the reorder point to absorb unexpected demand spikes or supply chain disruptions.
The formula for a reorder point:
Reorder point = (average daily usage × lead time in days) + safety stock
Example: if you use 10 lbs of chicken breast per day on average and your distributor delivers every 3 days, your base reorder point is 30 lbs. Add 5 lbs of safety stock inventory to buffer against a busy weekend or a delayed delivery, and your reorder point is 35 lbs. When on-hand quantity hits 35 lbs, the order goes in.
Safety stock is not a fixed number. It should be calibrated to:
- Lead time variance from your supplier (inconsistent delivery windows require more buffer)
- Demand variance by day of week (Friday-Saturday spikes may need extra safety stock on proteins)
- The cost of a stockout vs. the storage costs of holding extra product
For perishable goods with a 3-5 day shelf life, safety stock needs to be sized so you can use it before it spoils. Excess safety stock on produce is waste, not protection.
Minimum order quantity (MOQ) from your distributors affects reorder strategy as well. If your distributor requires a minimum order quantity of a case when you only need half a case, your carrying costs go up. Understanding your supplier's MOQ by item helps you set reorder points that minimize both stockouts and over-purchasing.
6. Just-in-time inventory
Just-in-time (JIT) inventory is a technique that minimizes on-hand stock by ordering precisely what is needed right before it is needed. In manufacturing and e-commerce, JIT and dropshipping models eliminate the need to hold inventory on-site at all. In restaurants, you can't ship an ingredient directly to a customer's table: the food has to be produced in your kitchen, which means you will always hold some inventory on-site. JIT in a restaurant is partly aspirational and partly operational reality.
Some distributors also support cross-docking arrangements, where products are transferred directly from the delivery truck to your prep area without entering a storage location. This reduces handling time and supports fresher product rotation, though it requires close coordination with your delivery schedule.
The JIT principle translates to restaurant operations in a few practical ways:
- Ordering proteins and produce 2-3 times per week instead of in one large weekly order, reducing the on-hand quantity that could spoil between service periods
- Sizing prep quantities to expected covers rather than to a static daily prep guide, so overproduction waste is reduced
- Building supplier relationships that support shorter lead times and flexible order adjustments
JIT's vulnerability in restaurants is supply chain disruptions. A distributor shortage, a delivery delay, or a demand spike that exceeds your order can create stockouts with no buffer stock to fall back on. Pure JIT with no safety stock is fragile. Most restaurant operators run a modified JIT approach: frequent smaller orders to reduce holding costs, combined with a calculated safety stock inventory on A items with no substitute.
7. Demand forecasting
Demand forecasting uses historical sales data to predict future inventory needs. In a restaurant, forecasting is the link between what your point of sale records and what your next purchase order says. Without it, ordering is based on habit. With it, ordering is based on what you actually sold during comparable periods.
The data inputs for accurate restaurant demand forecasting:
- Historical sales by item and daypart for the equivalent period (last four to six weeks of the same day of week)
- Known demand drivers: local events, weather patterns, promotions running this week but not last
- Menu changes that shift ingredient usage from a historical baseline
A restaurant running inventory management software connected to its POS can generate forecasted usage at the ingredient level from sales history without manual calculation. Without software, the same logic can be applied manually using exported sales reports: pull item-level sales for the past four comparable service periods, calculate the average, multiply by your recipe yield per unit sold to get projected ingredient usage.
Demand forecasting reduces both stockouts and overstocking, which are the two failure modes of inventory management. Stockouts cost you revenue and damage the guest experience mid-service. Overstocking drives up carrying costs and spoilage risk on perishable goods. Accurate forecasting narrows the gap between what you order and what you use.
8. Economic order quantity
Economic order quantity (EOQ) is a formula that identifies the optimal order size for a given ingredient by minimizing the combined total of ordering costs and holding costs.
EOQ = √(2 × annual demand × ordering cost per order ÷ holding cost per unit per year)
In a warehouse or manufacturing context, this formula drives major procurement decisions. In a restaurant, EOQ is most usefully applied as a thinking framework rather than a precise calculation: the larger each order, the lower the per-order cost (you make fewer deliveries), but the higher the holding costs (more storage space used, higher spoilage risk). The optimal order size sits somewhere between daily micro-orders and monthly bulk orders.
For restaurants, EOQ thinking most directly applies to:
- Dry goods and non-perishables, where shelf life is long enough for the formula to hold
- High-velocity items where distributor delivery fees per order are significant
- Items where bulk ordering qualifies for a volume discount that offsets the carrying cost of holding more inventory
For perishable goods, spoilage typically makes holding costs too high for large EOQ-style orders to make sense. Some specialty or seasonal items are available on consignment inventory terms, where you pay only after the product is used or sold, which changes the holding cost calculation significantly. These arrangements are uncommon with national distributors but occasionally available through local or specialty suppliers. Ordering costs and holding costs need to be weighed in the context of your specific storage capacity and product shelf life.
For a fuller picture of how inventory costs flow into your financial statements, Otter's guide to restaurant accounting and bookkeeping covers how COGS, cost of goods sold, and inventory valuation connect to your P&L.

The purchasing layer most restaurant operators haven't tapped
All eight techniques above address how you manage the inventory you already have. There is a separate lever on the purchasing side that affects food cost independently of how well you count and rotate.
Most independent restaurants pay full distributor pricing because they don't have access to the purchasing programs that large chains negotiate. That gap is now addressable.
Otter Inventory Savings connects restaurants to Foodbuy, the nation's largest foodservice Group Purchasing Organization (GPO), and earns cash back on purchases you're already making through your existing distributors. No new distributor relationships. No change to your ordering process. The program works on top of whatever inventory management system you already run.
The three savings layers:
- Cash-back rebates: 1-3% of qualifying purchases, paid monthly to your connected bank account
- Flash discounts: limited-time deals on eligible items that reduce what you pay upfront
- Rebate opportunities: personalized recommendations to switch to lower-cost, rebate-eligible alternatives based on your actual purchase history
On a restaurant spending $12,000 per month with a national distributor, 2% cash back is $2,880 per year returned before a single inventory count changes. Combined with tighter order management through the techniques above, the total impact on food cost compounds.
What separates restaurants that control food cost from those that track it after the fact
The eight techniques in this article are well-established. FIFO, ABC analysis, cycle counts, perpetual inventory, safety stock, JIT, demand forecasting, and EOQ are not new ideas. What separates restaurants with consistently tight food cost from those with chronic variance is not knowing the techniques. It is applying them before the service period, not reconstructing what happened after.
Inventory control is a pre-shift discipline. Par levels get set on Tuesday so Friday runs on autopilot. Reorder points get calculated before stockouts, not after. Cycle counts happen at the start of the week so variance surfaces while you can still respond to it.
The technology layer makes this sustainable. Inventory management software connected to your POS turns theoretical inventory usage into a real-time on-hand figure without manual calculation. An inventory management system with cycle count workflows, demand forecasting, and automated reorder points removes the human memory requirement from inventory control. When the system surfaces the signal, the manager acts. When there's no system, the signal gets missed.
Otter's overview of top restaurant technology solutions covers how POS, inventory, and ordering tools fit together for restaurant operators looking to reduce the manual overhead of food cost management.
Book a demo with Otter to see how inventory management and purchasing cash-back work together in one place.
Frequently asked questions about inventory management techniques
What are the most important inventory management techniques for restaurants?
FIFO (first in, first out) and cycle counts are the highest-impact starting points for most restaurants because they directly reduce spoilage and improve inventory accuracy without requiring software. ABC analysis adds structure to how often you count. A perpetual inventory system connected to your POS makes all of it more consistent by automating the link between sales and on-hand quantity. Start with the technique that addresses your biggest current problem: if spoilage is the issue, start with FIFO; if count accuracy is the issue, start with cycle counts.
What is the difference between FIFO and LIFO in restaurant inventory?
FIFO (first in, first out) means the first inventory received gets used first. LIFO (last in, first out) means the most recently received inventory gets used first. In restaurant operations, LIFO creates spoilage because older stock gets pushed further back while newer deliveries get used. FIFO is the correct method for perishable goods. LIFO is sometimes used in retail for inventory valuation purposes but is not appropriate for food service operations.
What is safety stock and how much should a restaurant hold?
Safety stock is the buffer quantity of an ingredient held above your reorder point to protect against demand spikes and supply chain disruptions. The right safety stock level depends on lead time from your supplier, how much your demand varies by day of week, and the shelf life of the ingredient. For perishable goods, safety stock should be sized to what you can use before it spoils. A practical starting point: 1-2 days of average usage for proteins and produce, calibrated up or down based on how reliable your distributor's delivery windows are.
What is ABC analysis in inventory management?
ABC analysis classifies inventory into three tiers based on value and usage rate. A items are high-value, high-usage ingredients that represent the majority of food cost, counted most frequently. B items are moderate value and usage, counted weekly. C items are low-cost or low-usage, counted monthly. The goal is to concentrate your team's inventory control effort on the items that most directly affect your cost of goods sold, rather than treating all inventory with the same counting frequency.
What is a perpetual inventory system and does a restaurant need one?
A perpetual inventory system tracks on-hand quantities in real time, updating automatically as sales occur and purchases are received. In contrast, a periodic inventory system only updates counts when a physical count is performed. For restaurants, the practical benefit of perpetual inventory is that reorder points trigger automatically, theoretical vs. actual variance is visible on demand rather than monthly, and ordering decisions are based on real usage data. Whether you need software to support it depends on your volume. High-volume QSR and fast-casual operations benefit significantly. Lower-volume concepts can approximate the same result with consistent cycle counts and a weekly reconciliation.
How does demand forecasting reduce food cost in restaurants?
Demand forecasting uses historical sales data to predict how much of each ingredient you will need for upcoming service periods. It reduces food cost by narrowing the gap between what you order and what you actually use. Less over-ordering means less spoilage on perishable goods. More accurate ordering means fewer stockouts that disrupt service. The most actionable version for independent restaurants is pulling 4-6 weeks of item-level sales data from your POS, calculating average usage per comparable service period, and adjusting orders accordingly. is visible on demand rather than monthly, and ordering decisions are based on real usage data. Whether you need software to support it depends on your volume. High-volume QSR and fast-casual operations benefit significantly. Lower-volume concepts can approximate the same result with consistent cycle counts and a weekly reconciliation.
How does demand forecasting reduce food cost in restaurants?
Demand forecasting uses historical sales data to predict how much of each ingredient you will need for upcoming service periods. It reduces food cost by narrowing the gap between what you order and what you actually use. Less over-ordering means less spoilage on perishable goods. More accurate ordering means fewer stockouts that disrupt service. The most actionable version for independent restaurants is pulling 4-6 weeks of item-level sales data from your POS, calculating average usage per comparable service period, and adjusting orders accordingly.

Book a demo to see how Otter’s all-in-one platform can help your restaurant thrive.