Table of contents
- Where Uber Eats actually stands in the US food delivery market
- Why national market share numbers can mislead you
- How Uber Eats built its position and where it's still growing
- What Grubhub's collapse means for restaurants still using it
- The bigger picture: consolidation is reshaping the delivery industry
- Translating market share into your channel decision
- How to check platform dominance in your specific market
- Using delivery market growth trends to negotiate better terms
- Platform selection is a business decision you should revisit every quarter
- The market share number that matters is the one from your own POS
- Frequently asked questions about Uber Eats market share
You're handing 15-30% of every delivery order to third-party platforms, and you need to know which ones are actually earning it. The most recent verified figures, from Earnest Analytics' Q4 2024 report (published February 2025), put DoorDash at 60.7% of U.S. food delivery sales, Uber Eats at 26.1%, and Grubhub at 6.3%. An earlier, widely-cited read from Bloomberg Second Measure put Uber Eats closer to 23%, based on March 2024 data.
Both numbers are real. Neither is current to this month, because no research firm publishes live, month-by-month share data. That gap is the first thing worth understanding before you make a channel decision. What follows breaks down what the latest verified numbers actually mean for your restaurant, where Uber Eats wins and loses, and how to turn market share data into a smarter channel strategy.
Key insights
- DoorDash controls roughly 61% of U.S. food delivery sales nationally per the latest verified data (Earnest Analytics, Feb 2025), but in dense urban markets like New York and Los Angeles, Uber Eats is running roughly even with it. Your city matters more than the national headline
- Your own POS order data by platform is the only market share number that should drive your channel strategy. National averages describe an average restaurant that does not exist
- A platform losing market share (Grubhub) has less negotiating leverage than it did when it wrote your contract: Grubhub sold for $650 million in 2024, down from the $7.3 billion its parent company paid for it four years earlier. Review your rates now, not at renewal
- Uber Eats is actively competing for restaurant partners, backed by a delivery business growing gross bookings 28% year over year (Uber Q1 2026 earnings). Its #2 status creates financial pressure to offer fee promotions and marketing credits. Ask for them before you sign or renew
Where Uber Eats actually stands in the US food delivery market
You're paying delivery commission fees to multiple apps and wondering which ones are pulling their weight. Here's the honest picture of the US food delivery market right now, along with exactly where each number comes from.
The national split, and why two sources don't agree
Source | Data period | DoorDash | Uber Eats | Grubhub |
|---|---|---|---|---|
Q4 2024 (published Feb 2025) | 60.7% | 26.1% | 6.3% | |
March 2024 | ~67% | ~23% | low single digits |
Both firms measure consumer card-spend panels, not platform-disclosed figures, and neither has published a 2026 update as of this writing. The direction is consistent (DoorDash leads by roughly 2-to-1, Uber Eats is a solid #2, Grubhub has fallen to mid-single digits), but treat any specific percentage as a snapshot of the quarter it was measured, not a live number.
What "market share" actually measures
This is where most coverage misleads you. Market share can mean:
- Sales volume (gross order value in dollars)
- Order count (number of transactions)
- Active users (monthly app users)
A platform with high-value orders can hold a larger dollar share than order-count share. Uber Eats skews toward higher average order values in urban markets, which makes its dollar-share look stronger than its transaction-share. When you see a headline number, ask which metric it's using and which firm measured it.
The order-volume gap in plain terms
Using the Earnest Analytics Q4 2024 figures above, Uber Eats' 26.1% share is roughly 43% of DoorDash's 60.7% share, meaning DoorDash processes a little over twice Uber Eats' order volume nationally, not the "one-third" ratio sometimes cited. That ratio still directly affects how you should allocate promotional spend, menu optimization time, and dispute management effort.
One thing worth noting: Uber Eats leads outside the U.S. It operates in 45 countries as of 2026, and international revenue funds continued U.S. investment. Uber's overall delivery segment posted $25.99 billion in gross bookings in Q1 2026 alone, up 28% year over year (Uber Q1 2026 earnings release). This is not a platform in freefall. It is a well-capitalized #2 that is actively competing for your business.
How Uber Eats built its position and where it's still growing
Uber Eats didn't close in on DoorDash's share by accident. It also didn't start out as "Uber Eats" at all: the product launched in August 2014 as UberFRESH, a narrow lunch-delivery pilot in Santa Monica, and was renamed Uber Eats in 2015 as it grew into a full marketplace (Uber's own newsroom announcement). A few things drove its growth since then.
Global footprint and Uber One
Operating in 45 countries means Uber Eats is not dependent on U.S. market share to stay financially healthy. International bookings help fund U.S. growth.
Uber One, the membership that bundles rideshare and food delivery into one subscription, passed 50 million members in Q1 2026, up from 30 million at the end of 2024, and now drives more than half of Uber's total gross bookings company-wide. That kind of retention advantage, tying grocery and food orders to the same membership people use for rides, is one a standalone food app can't easily match.
Alcohol delivery, Postmates, and ghost kitchens
Alcohol delivery. Uber acquired the alcohol marketplace Drizly in 2021, but shut the Drizly brand down entirely by the end of March 2024, folding its alcohol-delivery function directly into the Uber Eats app instead of running it as a separate product (CNN; CBS News). For fast-casual and QSR operators that carry beer or wine, alcohol ordering now lives natively inside Uber Eats in eligible states.
Postmates. Uber acquired Postmates in 2020. The driver-facing Postmates app was merged into Uber's driver app back in 2021, but the customer-facing Postmates app and brand are still active today, with its strongest footprint in Western U.S. markets, particularly California. Orders placed there route through the same Uber Eats logistics backend.
Ghost kitchens and virtual brands. Uber Eats has actively courted ghost kitchens, also called dark kitchens or cloud kitchens, and virtual brand operators, offering dedicated support and promotional placement. If you run a delivery-only concept, Uber Eats' investment in this segment is worth factoring into your platform decision.
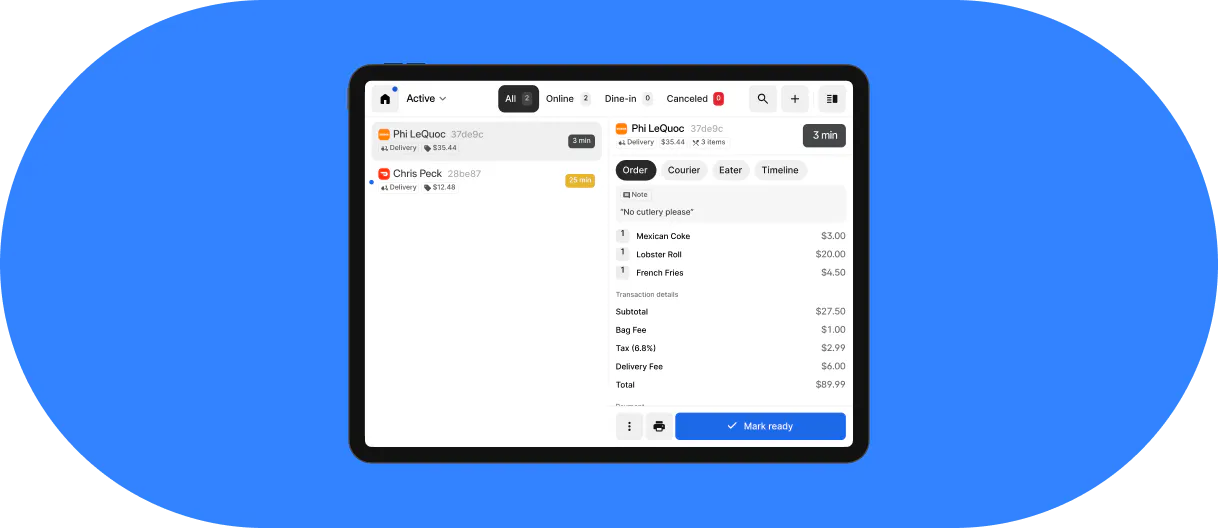
For operators running virtual brands or multi-location fast-casual concepts, keeping tabs on per-platform order performance is where Otter earns its place. Otter's order management pulls orders from DoorDash, Uber Eats, Grubhub, and your own direct channel into one screen, and Otter Analytics breaks performance down by channel so you can see which platforms are actually contributing to your margin, no separate tablet per platform and no manual exports required.
Christina Hong, owner of Seoulmates in Beverly Grove, Los Angeles, relies heavily on third-party delivery for her Korean fusion restaurant. After switching from Toast, she described the difference this way:
"One of my favorite things about Otter is the integration with the third-party deliveries. It makes my job as an owner so much easier. Everything is in one place and runs smoothly, because we rely on a lot of those third-party deliveries for our business."
What Grubhub's collapse means for restaurants still using it
Grubhub really was the U.S. market leader once. In July 2018 it held roughly 34% of U.S. food delivery orders, ahead of Uber Eats at 28% and DoorDash at 18% (Edison Trends data, via Edison founder's summary). Today its share sits at roughly 6% (Earnest Analytics, Q4 2024).
The ownership history tells the story as clearly as the share numbers do. Just Eat Takeaway.com bought Grubhub for $7.3 billion in 2020. Four years later, it sold Grubhub to Wonder Group for an enterprise value of just $650 million (CNN Business; Just Eat Takeaway.com newsroom), a roughly 90% write-down. Consumers moved to DoorDash and Uber Eats during that stretch and haven't come back in meaningful numbers.
Fewer active consumers on the app means fewer eyes on your listing. Lower order volume is the direct operational consequence.
Here's the audit question worth asking yourself: if Grubhub accounts for fewer than 5% of your delivery orders, is the operational load (another menu to update, another stream of disputes, another set of payouts to reconcile) returning enough revenue to justify staying live?
That's not a blanket recommendation to leave. Some Northeast metros still have pockets of stronger Grubhub usage, a legacy of its Seamless roots in New York specifically, where Grubhub still held 17.6% share at the end of 2024 even as DoorDash and Uber Eats ran near-even for the rest (Earnest Analytics). Check your own data before deciding. But treat this as a recurring review, not a one-time choice.
The bigger picture: consolidation is reshaping the delivery industry
Zoom out and the Uber Eats/DoorDash/Grubhub story in the U.S. is one piece of a much larger, fast-consolidating global industry that market researchers classify under the umbrella term "platform-to-consumer services." A few data points frame the scale and direction of that consolidation:
Market size
The U.S. online food delivery market is projected to grow at roughly a 9.6% CAGR from 2025 to 2030, according to Grand View Research. Globally, the same firm sizes the online food delivery industry at $355.6 billion in 2026, on track to reach $505.5 billion by 2030. Statista uses a broader definition that folds in grocery and quick-commerce delivery and arrives at a larger US figure, roughly $473 billion in consumer spending among U.S. consumers for 2026 with 12.8% growth this year alone. The two estimates aren't measuring identical categories, so treat the CAGR range (roughly 9-13%, depending on scope) as more reliable than any single dollar figure.
Consolidation among the platforms themselves
The pattern showing up in Grubhub's sale is showing up industry-wide. DoorDash completed its acquisition of the UK-based platform Deliveroo in October 2025, for roughly $3.9 billion (DoorDash investor relations), folding Deliveroo Plus into its DashPass subscription family. Combined, DashPass, Wolt+, and Deliveroo Plus passed 35 million members by the end of 2025, up from 22 million DashPass members alone a year earlier.
Outside the U.S., the largest platform-to-consumer players are regional rather than global. Delivery Hero operates across Europe, Asia, and Latin America under brands including Foodpanda. Zomato (whose parent company rebranded as Eternal) and Swiggy dominate India's market through localized operations and deep restaurant partnership networks. None of these directly compete for U.S. restaurant partners today, but they illustrate that DoorDash's and Uber Eats' current maneuvering, bundling subscriptions, buying competitors, exiting alcohol side-brands, is standard playbook for this industry everywhere it operates.
The category is blurring into grocery and instant delivery
Uber Eats users and DoorDash users increasingly order groceries and convenience items through the same apps, putting both platforms in more direct competition with dedicated grocery delivery players like Instacart and instant-delivery specialists like Gopuff. That overlap is part of why Uber and DoorDash have leaned into subscriptions (Uber One, DashPass) that bundle rides, food, and grocery delivery rather than charging separately for each.
What incumbency actually looks like
Two restaurant brands illustrate the range of outcomes. McDonald's launched McDelivery nationally in the U.S. through an exclusive 2017 partnership with Uber Eats, expanding to more than 5,000 restaurants within about a year before later adding DoorDash and other partners once the exclusivity period ended (Food On Demand). Domino's Pizza took the opposite path for years, building Domino's Rewards into a direct-ordering loyalty program with more than 23 million active members served almost entirely through its own app, before adding DoorDash as a delivery partner in April 2025 (Food On Demand). Even the industry's strongest direct-ordering success story now sees incremental value in a marketplace listing, which is the same incremental-order math this article keeps coming back to.
How to check platform dominance in your specific market
Don't rely on a national chart, or even a city-level one, if your metro isn't in it. Here's how to find out what's actually happening in your zip code.
Step 1: Pull your own order data by platform over the last 90 days.
Your actual numbers are the most relevant signal. Otter's consolidated dashboard surfaces this without manual exports.
Step 2: Check app store top charts by metro.
Both the Apple App Store and Google Play show top Food & Drink apps by city. A two-minute check reveals where consumer attention is concentrated in your specific market. Nationally, DoorDash also leads on raw app downloads and usage share; it draws an estimated 78% of its global app downloads from the U.S. against roughly 25% for Uber Eats, and leads U.S. usage share at around 54% (Statista).
Step 3: Ask your platform reps directly.
Uber Eats and DoorDash sales reps have local market data and share it to win or retain restaurant partners. Use this conversation as both a research tool and an opening for platform negotiation.
Step 4: Tap local operator networks.
Facebook groups for restaurant owners, neighborhood business associations, and peer conversations surface real-world platform performance faster than any published report.
Use what you find to decide where to buy platform-sponsored ads, which platform gets your next promotional offer, and whether to pause a platform during slow periods to reduce overhead.
Using delivery market growth trends to negotiate better terms
Market share trajectory is a platform negotiation signal. A platform losing share needs your restaurant more than one gaining share, even if neither rep will say so directly.
Grubhub's decline means its negotiating leverage is at an all-time low, backed up by the number that matters most to its own former owner: a $7.3 billion acquisition unwound into a $650 million sale in four years (CNN Business). If you're still live on it, you're in the strongest position to request reduced commissions or promotional placement.
Uber Eats, as a growing #2 competing hard against DoorDash and backed by a delivery business posting 28% year-over-year gross bookings growth (Uber Q1 2026 earnings), has financial pressure to retain restaurant partners. It has offered trial periods at reduced fees, marketing credits, and free promotional placement to attract volume. Ask for these explicitly when onboarding or renewing.
DoorDash, as the dominant leader and now the owner of Deliveroo internationally, faces less competitive pressure domestically but is not immune. Volume commitments, exclusive launch windows for new menu items, and DashPass promotional participation can open fee discussions.
Review your delivery contracts on a fixed annual schedule. Operators who run on Otter can pull consolidated order and payout data per platform before any negotiation meeting, arriving with exact order volume and commission cost by platform rather than relying on memory or rough estimates. Otter's Financials breaks down payouts and commission fees by delivery partner specifically for this kind of reconciliation. Otter's broader breakdown of what to look for in a POS system for delivery restaurants covers this kind of per-channel visibility in more depth.
Platform selection is a business decision you should revisit every quarter
The U.S. food delivery market size continues to grow (roughly 9-13% annually depending on whose scope you use), and third-party delivery platforms are competing hard for both consumer attention and restaurant partners. Uber Eats' national #2 position is not by itself a reason to be on it, off it, or to prioritize it over DoorDash. Your local market data, your margin math, and your operational capacity are the only inputs that matter.
Treating platform selection as a one-time onboarding decision means accepting terms and channel mixes that no longer reflect market reality. Multi-platform presence multiplies complexity: more menus to update, more disputes to manage, more payout reconciliation. The operators who scale delivery profitably are the ones who systematize operations rather than layer on platforms without a plan.
Here's the action list:
- Audit your current order mix by platform quarterly
- Check local app dominance in your specific metro
- Price menus per platform to protect margin
- Review delivery contracts annually
- Use consolidated tools to reduce per-platform operational overhead

See your real order split by platform