Table of contents
- What food cost variance actually tells you
- How to calculate food cost variance
- What a good variance looks like, and when to start worrying
- Price variance vs. usage variance: two different leaks, two different fixes
- How to diagnose which leak you actually have
- The five most common causes of food cost variance
- How to control food cost variance and keep it there
- How often you should measure food cost variance
- Catching variance weekly beats fixing it monthly every time
- Frequently asked questions about food cost variance
Money disappears between the invoice and the plate every week in most restaurants, and you probably don't see it until month-end, when it's too late to do anything about it. According to the National Restaurant Association's analysis of its 2025 Restaurant Operations Data Abstract, food and non-alcohol beverage costs represented a median of 32.4% of sales for limited-service operators and 32.0% for full-service operators in 2024, making food cost the most controllable line on your P&L. The problem isn't that food costs are high. It's that you can't tell why they're high or where the money is going.
That's what food cost variance tells you. The formula is straightforward, reading the number is learnable, and finding the specific leak, whether it's a supplier price problem, a portioning problem, or something else entirely, is a process you can build into your weekly food cost management routine.
Key insights
- Two root causes: Food cost variance has two structurally different root causes, price variance (you paid too much per unit) and usage variance (you used too many units). Applying the wrong fix to the wrong leak wastes time and margin
- Benchmark ranges: A variance of 0 to 2 percentage points above theoretical is well-controlled, 3 to 5 points warrants investigation, and above 5 points signals a systemic problem that will not self-correct
- Cadence matters: Monthly-only variance reporting almost always means you find the leak four weeks after it started. Weekly spot-counts on your top-cost ingredients turn a month-end surprise into an operational rhythm
- Break it down: Aggregating variance to a single restaurant-wide number hides the patterns that reveal the cause. Breaking it down by ingredient, daypart, location, or shift is where actionable signals live
What food cost variance actually tells you
Food cost variance is the gap between two numbers: theoretical food cost and actual food cost.
Theoretical food cost, sometimes called ideal food cost, is what your recipes say you should have spent, given exactly what you sold. It assumes every portion is correct, every delivery is accurate, and nothing is wasted. It's the baseline your kitchen would hit if everything went perfectly.
Actual food cost is what you really spent, calculated like this:
(Beginning Inventory + Purchases − Ending Inventory) ÷ Food Sales
The difference between those two numbers is your variance. A positive variance means you spent more than your recipes predicted, the most common outcome and the costly one. A negative variance means you spent less, which sounds like a win but usually isn't. Consistently beating theoretical often means portions have quietly shrunk, or purchases are being deferred into the next period's invoices. Both deserve a look.
The variance number itself isn't a grade. It's a signal. A 3-point variance on $50,000 in monthly food sales is $1,500 leaving before anyone notices. That's the stakes, and it's why food cost control depends on catching the number early, not just calculating it correctly.
How to calculate food cost variance
Three versions of the formula, depending on what you need:
Dollar variance:
Actual Food Cost $ − Theoretical Food Cost $ = Variance $
Percentage-point variance:
Actual Food Cost % − Theoretical Food Cost %
Variance as a percentage of theoretical (how far off you are, relative to your target):
(Actual Food Cost % − Theoretical Food Cost %) ÷ Theoretical Food Cost % × 100
Here's a worked example for a fast-casual operator:
Food sales for the period: $56,000
Actual food cost: $18,200, or a 32.5% actual food cost percentage
Recipe costing puts theoretical food cost at 29.0%
Variance: 3.5 percentage points, or 12.1% above theoretical
That 12.1% above theoretical is worth chasing. It doesn't tell you why yet, but it tells you the leak is real and material.
To build the theoretical number, multiply each menu item's recipe cost by the number of units sold, pulled from your POS sales data, then sum across the full menu for the period. Two inputs must be accurate for this to mean anything: current ingredient prices in your recipe cards and an honest ending inventory count. If either is stale, the variance number is noise, not signal.
Most independent operators can run this in a spreadsheet weekly if they pull sales data from their POS and log invoices consistently. No specialized inventory management software or a dedicated inventory management system is required to start.
What a good variance looks like, and when to start worrying
Here are concrete benchmarks:
- Well-controlled range: 0 to 2 percentage points above theoretical
- Needs investigation: 3 to 5 points above theoretical
- Above 5 points: Systemic problem that will not self-correct
QSR and fast-casual operators with tight, repetitive menus should target closer to 1 to 2 points. Fewer menu variables mean less noise in the theoretical calculation.
Ghost kitchens and virtual brands running multiple concepts from one kitchen often see higher variance because of shared ingredient pools and frequent menu changes. Three to four points may be contextually acceptable, but break it down by concept before accepting it. Shared ingredients across concepts make it easy for one underperforming menu to hide inside an acceptable aggregate number.
If you run multiple locations, a 2-point house average can mask one location running at 6 points and dragging the others down. Aggregate variance hides location-level problems by design.
Negative variance still warrants scrutiny. If you're consistently beating theoretical, verify portion sizes haven't quietly shrunk and confirm purchases aren't being deferred into the next period's invoice.
Treat these benchmarks as investigation triggers, not performance ceilings. The goal is to understand the number, not just minimize it.
Price variance vs. usage variance: two different leaks, two different fixes
Here's the structural split most articles skip entirely: food cost variance has two root causes that require completely different remedies. Conflating them is why many operators spend months fixing the wrong thing.
Price variance means you paid more per unit than your recipe assumed. Causes include supplier price increases, commodity swings, invoice errors, or buying outside contracted programs. The fix lives on the sourcing side: renegotiate contracts, lock pricing, switch distributors, or access group purchasing discounts. This is where cost control at the procurement level matters most.
Usage variance means you used more units than the recipe required. Causes include over-portioning, waste, spoilage, theft, or counting errors. The fix lives on the operational side: train staff, enforce recipe standards, tighten count frequency, add waste logs. Solid portion control and disciplined recipe costs are your primary tools here.
Why does the distinction matter? If you spend two months retraining staff on portioning but your beef supplier just raised prices 15%, variance barely moves. You were fixing the wrong leak with the wrong tools.
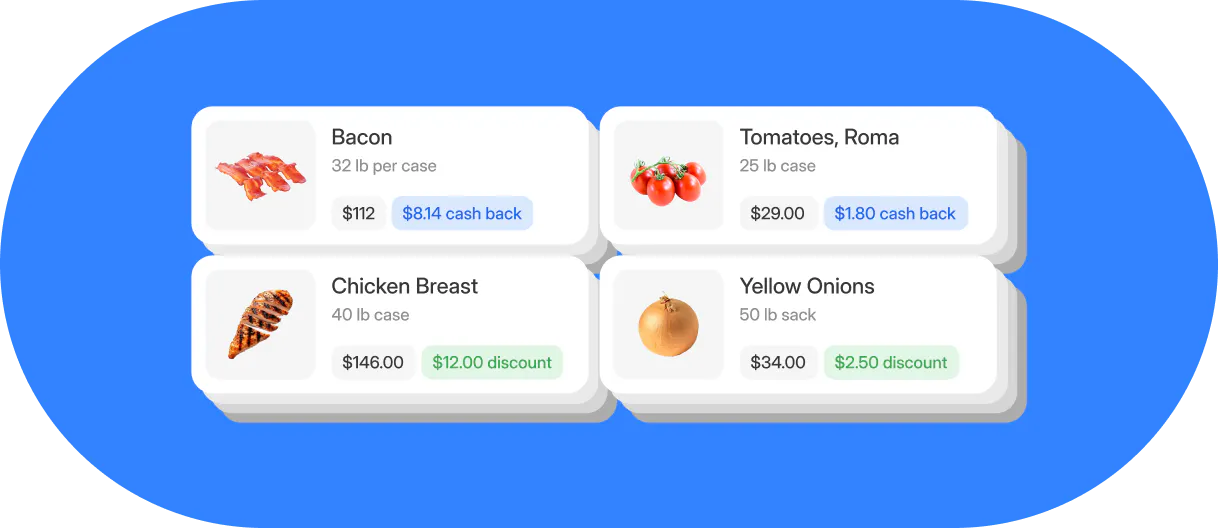
Otter's Inventory Savings connects restaurants to distributor cash-back rebates and personalized recommendations for lower-cost, rebate-eligible alternatives, directly attacking the price variance side of the equation. Confirmed cash back is typically paid out roughly 90 days after enrollment, since distributors need time to confirm eligible purchases, so set expectations accordingly. But addressing what you pay per unit is a lever that operates completely independently of what your staff does on the line.
Practical self-test: if variance spiked this period but your portion logs and waste records are clean, suspect price variance first. Pull invoices and compare unit prices to recipe card assumptions line by line.
How to diagnose which leak you actually have
Think of this as a triage workflow, a decision map that moves you from "variance is too high" to a specific action on Monday morning.
- Spike after a delivery cycle: Compare that invoice's unit prices to recipe card assumptions and check for short shipments and substitutions. This is almost always price variance.
- Low-cost high-volume items: Fries, sauces, garnishes, and toppings running high point to a portioning problem. Run a plate weight audit or have a manager shadow the station for one shift.
- Consistent variance week-over-week: With no menu changes and stable supplier prices, suspect a counting error or theft. Run a surprise mid-week count and reconcile it against POS units sold for that ingredient.
- Variance tied to a specific daypart or shift: This points to a staff compliance failure. Recipe card adherence and targeted retraining are the fix, not a new system.
- Variance during high-volume periods: This usually means over-prep waste and spoilage from over-production. Tighten par level discipline and forecast prep quantities to projected covers, not to a round number.
Aggregating variance to a single restaurant-wide number makes all these patterns invisible. Breaking it down by item, daypart, or location is where the actionable signal lives.
The five most common causes of food cost variance
Over-portioning and recipe non-compliance
A burger specced at 6 oz of beef running at 7 oz adds roughly 17% to that item's food cost. Multiply across 200 covers a day and the profit margins disappear before service ends. Weight-based specs and regular portion audits are the primary control. A handful is not a portion size, and portion control without a written spec is just a guess.
Food waste and spoilage
Commercial kitchens typically waste 4% to 10% of the food they purchase before it ever reaches a guest, according to LeanPath data cited by the National Restaurant Association. Over-production relative to forecasted demand, first in, first out (FIFO) failures, and improper storage are the main culprits. Waste logs, waste tracking by shift, and prep-to-forecast discipline are the fix for both wastage and shrinkage.
Inaccurate inventory counts
If the beginning or ending inventory count is wrong, every variance calculation built on it is wrong. Teams that rush or skip inventory counts introduce systematic error that masks every other problem. Consistency of method matters as much as frequency.
Supplier price fluctuations and substitutions
A vendor swaps a product or raises a price mid-period. If recipe costs don't update, theoretical drops and variance looks artificially high. Verify delivery receipts against purchase orders at the dock, and update recipe costs whenever a key ingredient price moves more than 5%.
Theft and shrinkage
High variance on high-value, small-portion items, proteins, cooking fats, and specialty ingredients, with otherwise clean operations is often the signal. Dual-count procedures and restricted access to high-value inventory are the standard controls.
Each of these is solvable. The key is identifying which one you're actually dealing with before you start fixing things.
How to control food cost variance and keep it there
- Standardize recipes: Build standardized recipes with gram or ounce specs for every portioned ingredient and post them at every station. This is the single highest-leverage control in your kitchen, and it's the foundation of any serious recipe costing effort.
- Build a waste log staff actually use: Keep it simple: item, quantity, reason, time of day. Make it a shift-checklist item, not an optional add-on.
- Set a minimum count cadence: Weekly spot counts on your top-5 highest-cost ingredients, full counts monthly. Monthly-only is a margin trap.
- Verify every delivery at the dock: Check unit counts, weights, and unit prices against the purchase order before signing. Short shipments and substitutions caught at receiving never enter your variance calculation.
- Teach staff the real cost of portioning errors: One extra ounce of chicken per plate times 200 plates per day times $0.35 per ounce equals $70 per day, or $2,100 per month. That number lands during staff training. A lecture about cost awareness does not.
- Update recipe costs regularly: Do this at minimum quarterly and immediately when a key commodity price shifts more than 5%. Stale theoretical costs make the whole formula meaningless.
- Standardize across locations: Multi-location operators should standardize the counting method and schedule across every site and investigate unusual location-level variance while the period is still fresh enough to diagnose.
Good cost control isn't about one big fix. It's about building habits and operational efficiency that catch small leaks before they become large ones.
How often you should measure food cost variance
The minimum viable cadence for an independent operator: full variance calculation monthly, spot-check variance on top-cost items weekly.
The case against monthly-only: a portioning problem that begins week one costs four full weeks of margin before it surfaces on the P&L. Weekly checks on your highest-COGS items catch it in days, not weeks.
Ghost kitchens and virtual brands with frequent menu changes should run variance weekly at minimum. Menu swaps reset the theoretical baseline, and compounding errors move fast when you're running multiple concepts.
If you run multiple locations, track variance by site weekly. Aggregate numbers hide the pattern. "Location 3 is 4 points high on ground beef this week" drives a phone call. "Food cost is slightly elevated company-wide" drives nothing.
The data you need is already in your restaurant management system. Otter POS captures real-time sales data across all channels, dine-in, delivery, and takeout, giving you the complete sales mix foundation needed to run theoretical cost calculations. Otter Analytics connects that POS data with inventory management integrations so you can spot cost variances at the item level before margins erode, rather than waiting for a month-end report. Pulling that data weekly turns variance from a month-end surprise into a weekly operational rhythm.
Nicoletta Kuti, co-owner of Telly's Charburgers in Santa Clarita, uses this kind of item-level visibility to catch underperforming menu items before they quietly drag down profitability:
"I like your guys' reporting. Specifically the product mix report, it tells us what we've sold the most for the day, to the least. We got Otter back in May, and since then we've cut out three items that were really just costing us money to have on the menu. I feel that has been beneficial."
Catching variance weekly beats fixing it monthly every time
Food cost variance is not a financial metric you review after the fact. It's an operational signal you act on while the problem is still small.
Every week you don't measure is a week the leak runs unchecked. A 4-point variance on $15,000 in weekly food purchases is $600 gone before you open the spreadsheet, which adds up to $31,200 in lost profit a year.
The operators who control food cost best are not the ones with the most sophisticated software. They're the ones who look at the numbers every week and ask what changed.
Return to the two-leak framework: knowing whether you have a price problem or a usage problem cuts the list of possible actions in half before you do anything. Applying the wrong fix wastes both time and margin.
Here's a concrete first action: pick your five highest-cost ingredients, count them today, compare to what your POS says you sold this week, and calculate the gap. That rough number, however imperfect, is more useful right now than waiting for month-end.
For a deeper look at the other side of the equation, Otter's guide to restaurant accounting and bookkeeping covers how food cost percentage fits into your broader financial reporting, and Otter's menu pricing strategies guide covers how to reset menu price once you know where your real costs stand.
Ready to get a clearer picture of where your restaurant food cost is going? See how Otter can help.
Frequently asked questions about food cost variance
What is food cost variance?
Food cost variance is the difference between your theoretical food cost (what your recipes say you should spend based on what you sold) and your actual food cost (what you actually spent during the same period). It signals whether money is leaking through over-portioning, waste, supplier price changes, counting errors, or theft.
What is the food cost variance formula?
The basic formula is Actual Food Cost % minus Theoretical Food Cost %. To express variance as a percentage of theoretical: (Actual Food Cost % − Theoretical Food Cost %) ÷ Theoretical Food Cost % × 100. In dollars: Actual Food Cost $ minus Theoretical Food Cost $. A positive result means you spent more than your recipes predicted.
What is the difference between actual and theoretical food cost?
Theoretical food cost is what you should have spent based on your recipes and your sales mix. It assumes perfect portioning, accurate deliveries, and zero waste. Actual food cost is what you really spent, calculated as beginning inventory plus purchases minus ending inventory, divided by food sales. The gap between the two, your actual vs. theoretical food cost variance, is what the rest of this formula is built to explain.
What is an acceptable food cost variance for a restaurant?
As a directional benchmark, 0 to 2 percentage points above theoretical is well-controlled, 3 to 5 points warrants investigation, and above 5 points signals a systemic problem. QSR and fast-casual operators with tight, repetitive menus should target 1 to 2 points. These are investigation triggers, not hard rules.
What is the difference between price variance and usage variance?
Price variance means you paid more per unit than your recipe assumed, caused by supplier price increases, commodity swings, or invoice errors. Usage variance means you used more units than the recipe required, caused by over-portioning, waste, spoilage, or theft. Price variance is solved on the sourcing side; usage variance is solved through portion control, staff training, and operational discipline.
What causes high food cost variance?
The five most common causes are over-portioning, food waste and spoilage, inaccurate inventory counts, supplier price fluctuations or substitutions, and theft or shrinkage. The key diagnostic step is identifying whether you have a price problem or a usage problem, because the fix for each is completely different.
How does cost of goods sold relate to food cost variance?
Cost of goods sold, or COGS, is the accounting term for what actual food cost measures: beginning inventory plus purchases minus ending inventory. Your food cost variance is simply your COGS-based actual food cost percentage compared against your theoretical food cost percentage for the same period.
How often should I calculate food cost variance?
Run a full variance calculation monthly at minimum, and do weekly spot-checks on your five highest-cost ingredients. Monthly-only reporting is too slow: a portioning problem that starts week one costs four weeks of margin before it appears on the P&L.
How do I reduce food cost variance in my restaurant?
The highest-leverage actions are standardizing recipes with weight-based portion specs, increasing count frequency for high-cost ingredients, verifying deliveries against purchase orders at the dock, maintaining an active waste log, and updating recipe costs whenever a key ingredient price changes more than 5%. If variance is driven by supplier prices rather than usage, accessing group purchasing discounts or renegotiating contracts addresses the price side directly.

See where your food cost is leaking