Table of contents
- What menu costing actually is (and why the formula alone won't save you)
- Gather these numbers before you cost a single dish
- How to calculate food cost per dish, step by step
- How to calculate your total food cost (COGS method)
- What food cost percentage should you actually target?
- Theoretical vs. actual food cost: how to find the gap and fix it
- How to set a selling price when the math gives you a number guests won't pay
- When to re-cost your menu (specific triggers, not "review regularly")
- Costing your menu once is a start: keeping the numbers current protects your margin
- Frequently asked questions about menu costing
You built your menu around the food you love to make. But if you have not run the numbers lately, or ever, you may be selling dishes that quietly drain your margin every single service. Food costs are volatile, kitchens are not perfect, and the menu costing template or spreadsheet you set up at launch is probably working off menu prices and ingredient costs that no longer exist.
We walk through every step of menu costing here: how to gather the right inputs, how to calculate food cost per dish and your total food cost (COGS method), how to read the gap between what your recipe cards say and what your monthly report shows, and what to do when the math gives you a price your guests will not pay.
Key insights
- Your recipe card shows ideal cost, your COGS report shows real cost. The gap between them is your kitchen's performance report, and a 3-point gap on $70,000 per month in food sales is $2,100 leaving the business every month through waste, over-portioning, or theft.
- The 28 to 35% food cost benchmark is a reference, not a target. Your actual ceiling is determined by what is left after labor costs, rent, and overhead costs, not by an industry average calculated on a different cost structure than yours.
- Re-costing is triggered by events, not calendars: a supplier price spike above 5%, a new distributor, a seasonal rotation, an unreported kitchen portion change, or a sustained COGS gap are all re-costing triggers. “Review regularly” is not an actionable plan.
- When the formula gives you an unworkable price, fix the dish before you change the number: adjust portion, swap an ingredient, or use your POS sales-mix data to identify a high-margin pairing that subsidizes the item before you consider removing it or raising the price.
Gather these numbers before you cost a single dish
Accurate menu costing requires four inputs. Skip any one of them and your plate cost is a guess.
- Invoiced unit price per ingredient: the price you actually paid, from a real invoice, not a price you remember
- Usable yield percentage: how much of the purchased ingredient is left after trim, cooking loss, or prep waste
- Exact portioned quantity per recipe component: the spec weight or volume for every ingredient as it goes on the plate
- Standardized recipes on a written recipe card, capturing every sub-component: proteins, starches, sauces, garnishes, and any shared prep items like house dressings
Why yield percentage changes everything
Here is a concrete example. You buy 5 lbs of chicken breast for $15.00. After trimming, you get 80% usable meat, 4 lbs. Your true cost per unit is $15.00 ÷ 4 lbs = $3.75/lb, not the $3.00/lb your receipt suggests. Skip the yield calculation and you are systematically underpricing every protein dish on your menu.
How to structure your menu costing template
A basic menu costing spreadsheet, which doubles as a food cost calculator, needs these columns:
Column | What goes here |
|---|---|
Ingredient | Name of each component |
Purchase unit | lb, oz, each, gallon |
Purchase price | From your invoice |
Usable yield % | Based on your actual prep |
Cost per usable unit | Purchase price ÷ yield % |
Recipe quantity | The portioned amount per dish |
Extended cost | Cost per usable unit × recipe quantity |
Sum the extended cost column. That total is your plate cost.
Practical tip: Use invoices from the last four to six weeks and average the price rather than pulling a single week's number. This smooths out volatility and gives you a more defensible cost baseline, especially useful when commodity prices are moving.
For ghost kitchens and multi-location operators: Cost per location, not per concept. Supplier pricing and case sizes often vary by delivery area. A blended cost card across locations will be wrong for all of them.
The top complaint among independent operators is the manual work of updating spreadsheets every time a supplier price changes. That frustration is real, and it is exactly why a trigger-based re-costing approach (covered later) matters more than a fixed schedule.
How to calculate food cost per dish, step by step
The formula: Food cost per dish = sum of (yield-adjusted cost per unit × portioned quantity) for every ingredient in the recipe.
A fast-casual example: grain bowl
Ingredient | Yield-adj. cost/unit | Recipe qty | Extended cost |
|---|---|---|---|
Brown rice (cooked) | $0.18/oz | 6 oz | $1.08 |
Roasted chicken | $0.47/oz | 4 oz | $1.88 |
Roasted vegetables | $0.12/oz | 3 oz | $0.36 |
House sauce | $0.09/oz | 1 oz | $0.09 |
Garnish (herbs, seeds) | n/a | n/a | $0.19 |
Plate cost | $3.60 |
That garnish line is a Q factor: a small flat estimate for hard-to-weigh extras like herbs, seeds, oil, and condiments. Let us say the actual plate cost lands at $4.20 after accounting for all components.
Food cost percentage: $4.20 ÷ $14.00 selling price × 100 = 30%.
Back-solving for price: If your target food cost percentage is 30% and plate cost is $4.20, your minimum selling price is $4.20 ÷ 0.30 = $14.00.
Portion control is a direct cost lever
If a team member plates 5 oz of protein instead of the 4 oz spec on every ticket, that dish's real cost is 25% higher than your recipe card shows, with no change to the menu price. Portion creep is one of the quietest margin killers in any kitchen, which is why portion control belongs in your costing system, not just your training manual.
Otter's menu management tools let you mark items unavailable in real time. When an ingredient runs short and no costed substitute is ready, pulling the item prevents the kitchen from improvising a higher-cost version and serving it at the wrong price.
How to calculate your total food cost (COGS method)
Per-dish costing sets your prices. Your total food cost, calculated using the COGS method, tells you whether the kitchen is executing those prices correctly across a full month.
The formula: (Opening inventory + Purchases − Closing inventory) ÷ Net food sales × 100.
Numeric example
- Opening inventory: $8,000
- Purchases: $22,000
- Closing inventory: $7,500
- COGS: $22,500
- Net food sales: $70,000
- Food cost %: 32.1%
A common error: using the wrong denominator
Use net food sales, after third-party delivery platform fees are stripped out. If you use gross sales including commissions, your food cost percentage looks artificially low. You are dividing your real costs by revenue you never actually received. When you compare against your total food sales, make sure both sides of the equation use the same net basis.
Multi-location and ghost kitchen operators: Track COGS % per concept, not blended across a shared commissary. Each concept has a different ingredient mix and price point. A blended number hides which concept is underperforming.
Otter's analytics surface sales data by location and concept. That figure is the denominator in this equation, and accurate sales reporting is the foundation of accurate food cost percentage. A POS that breaks revenue down by concept removes the manual aggregation step entirely. One operator described what that visibility does day to day:
“Another thing I love about Otter is the analytics side of it. On the back end, it is so easy to see the breakdown every single day, as well as the monthly sales, yearly sales. I'm able to compare this week to next week, see what days do better, what items are doing better. It just makes managing as a business owner so much better.”
Christina Hong, owner of Seoulmates, Los Angeles
What food cost percentage should you actually target?
The commonly cited benchmark is 28 to 35% for QSR and fast-casual, according to the National Restaurant Association. That range is a starting point, not an ideal food cost percentage you should copy without running your own numbers.
Why the benchmark may not apply to you
A protein-forward QSR concept with commodity chicken will structurally carry a higher restaurant food cost than a grain-and-vegetable bowl concept. The ingredients set the floor, not your skill as an operator. And a fine dining kitchen with premium proteins can justify a higher food cost than a counter-service format, because its price point and experience support it.
More importantly, food cost does not exist in isolation. It lives alongside labor, rent, and overhead. Use the prime costs frame instead: food cost plus labor cost combined should stay under roughly 60 to 65% of revenue. If your labor is running 38%, your food cost ceiling is closer to 22 to 27%, not the 30 to 35% the benchmark suggests.
Ghost kitchen and virtual brand note
Third-party delivery commissions of 15 to 30% compress your net revenue base. The same absolute plate cost represents a higher effective food cost % on a delivery order than on a dine-in ticket. Model delivery and in-store food cost % separately. They are different businesses running on the same kitchen.
The most honest approach: Work backward from your actual fixed and overhead costs and your income requirement. Calculate what percentage of revenue is left for food after rent, labor, and overhead are covered. That is your real target food cost percentage.
Theoretical vs. actual food cost: how to find the gap and fix it
Theoretical food cost is what your recipe costing cards say every dish should cost at perfect portioning and zero waste. Actual food cost is what your monthly COGS report shows you spent. The gap is your kitchen's performance report.
What the gap costs you in real dollars
A 3-percentage-point gap on $70,000 per month in food sales equals $2,100 per month leaving the business. That is $25,200 per year through waste, over-portioning, shrinkage, or theft, before you have made a single pricing decision.
Four root causes of the gap
- Portion creep: staff consistently plating over-spec
- Over-ordering and spoilage: purchasing more than prep and sales volume require
- Prep waste exceeding your yield assumption: your costing sheet says 80% yield, your kitchen is getting 70%
- Shrinkage and theft
A diagnostic sequence you can run without a culinary director
Step 1. Weigh dishes mid-service. Pick three to five menu items at random during a busy shift. Weigh them before they leave the pass and compare to the recipe spec. Do this unannounced.
Step 2. Audit your top-10 invoices against POS sales volume. Pull invoices for your ten best-selling items over the past four weeks. Calculate how much of each ingredient those sales should have consumed based on your recipe cards. Compare that to what you actually purchased. A significant gap points to spoilage, over-portioning, or theft.
Step 3. Count pre-close waste for two consecutive weeks. Before closing, have a manager count and record all usable waste: trim, unused prep, end-of-night throwaway. Compare those numbers to the yield percentages in your costing sheets. If actual waste consistently exceeds your yield assumption, your plate costs are understated.
Your POS product mix report shows which items sold and in what volume. Cross-reference that against your theoretical plate costs to calculate expected COGS. Comparing expected COGS to your actual COGS report gives you the gap size and tells you which direction to investigate first. This is the heart of menu analysis.
How to set a selling price when the math gives you a number guests won't pay
The formula says your grain bowl needs to sell for $18 at a 30% food cost target. The market ceiling in your neighborhood is $14. Most costing guides stop here. Here is what to actually do, and it is where real pricing strategies come in.
Option 1. Adjust the dish before you adjust the price
Reduce the protein portion size by 10%, swap one ingredient for a lower-cost alternative that does not change the dish's identity, or simplify a garnish. Even a $0.40 reduction in plate cost drops the minimum price from $18.00 to $16.67 at 30%, meaningfully closer to viable without touching the menu price.
Option 2. Use your sales mix to find a pairing subsidy
Your POS data shows which high-margin items customers order alongside this dish. If 65% of grain bowl orders include a $5.00 beverage at 15% food cost, calculate the contribution margin of the pairing. A $0.75 beverage cost against $5.00 revenue offsets a bowl running at 36%. The combined margin, and your overall menu mix, may be acceptable even if the bowl's individual food cost % is not.
Option 3. Change the format
Offer the same dish as a smaller lunch portion at a lower price, a combo build with a lower-cost add-on that raises the average check, or a limited-time special that tests a higher price point without a permanent menu commitment. A small markup on the add-on can lift the whole ticket.
Option 4. Remove the item
If no adjustment makes the economics work and the item does not demonstrably drive other high-margin purchases, the honest answer is to take it off the menu. Use your POS product mix data to confirm what percentage of revenue it represents before cutting. If it is 2% of sales and losing money, it is not worth keeping. This is menu engineering in practice: pricing and positioning each dish by its cost and its popularity.
Otter's bulk menu edit and real-time item availability features make format testing and temporary item pulls operationally simple. You can adjust an item, update all digital touchpoints at once, and pull it if it underperforms, without reprinting physical menus or logging into multiple delivery platforms separately. Smart menu design is easier when every channel updates from one place.
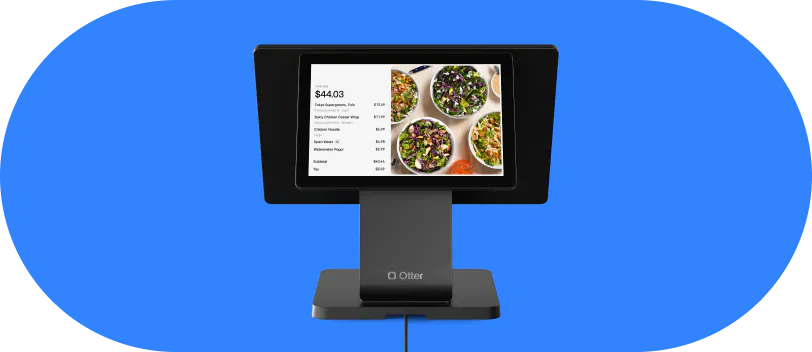

See which dishes are draining your margin