
Table of contents
- What demand planning actually means for a restaurant
- What bad demand planning actually costs you in food cost % terms
- The historical sales data you already have and how to read it
- Demand signals beyond last week: seasonal demand, events, and menu shifts
- How to set par levels based on what you'll actually sell
- Working backward from your delivery window to size each order
- Ordering cadence and distributor lead times
- The most common demand planning mistakes independent operators make
- A consistent weekly demand planning routine turns guessing into a system
- The operators who get food cost under control build a process, not a habit
- FAQ about inventory management and demand planning
You've done it. Ordered an extra case of salmon because last Saturday was slammed, and by Wednesday half of it is going in the trash. Or you ran out of your best-selling burger protein on a Friday night and had to 86 it at 7 p.m. Both mistakes cost real money. Both happen because most restaurants are guessing when they order.
ReFED's most recent Food Waste by Sector: Foodservice fact sheet estimates the U.S. foodservice sector generated 12.5 million tons of surplus food in 2024, worth roughly $157 billion, about 14% of foodservice sales. And per the National Restaurant Association, commercial kitchens typically waste 4% to 10% of the food they purchase before it ever reaches a plate. On a $1 million annual food budget, that's $40,000 to $100,000 walking out the back door every year.
What follows is a practical, step-by-step process to stop guessing and start ordering based on what you'll actually sell, using the sales data you're already capturing.
Key Insights
- Your POS already captures the demand signal you need. Item-level sales by day of week and daypart reveal variation that flat weekly totals hide entirely, and that variation is exactly what should drive differentiated order quantities per item
- Work backward from your delivery window, not forward from a sales forecast: start with when product arrives and what your distributor's cutoff is, then size each order to cover forecasted demand for that specific coverage window minus what's already on hand
- Demand planning is a direct food cost % lever. Spoilage and stockouts both inflate food cost with zero offsetting revenue, and even a 2-point improvement on $50K monthly revenue compounds to $12,000 saved per year
- Par levels go stale the moment your menu changes. The most common breakdown in demand planning isn't bad data, it's operators who set pars once and never update them after adding a dish, removing an item, or launching an LTO that shifts ingredient movement
What demand planning actually means for a restaurant
Demand forecasting is predicting how much of each menu item you'll sell over a specific window and using that prediction to order the right amount of each ingredient. No more, no less. Not a consultant's spreadsheet. Not a theoretical analytics exercise. A decision-making process that ends in a purchase order.
It's worth separating demand planning from inventory management, because operators often use the terms interchangeably. Inventory control tracks what you currently have on hand. Demand planning determines what you need to order before your next delivery so you don't run out or overflow. They work together: demand planning sets the quantities; inventory management tells you what's already in the walk-in so you don't double-order. Larger, multi-location groups sometimes formalize this as supply chain planning or procurement, run by dedicated demand planners; at the level of a single restaurant, it's really inventory planning built around what you'll actually sell.
Restaurants face a harder version of this problem than retailers do. A clothing store can hold unsold inventory for months. You can't. Perishability, 28-35% food cost targets, and fixed service windows leave almost no margin for error. Over-order and you're watching product spoil, tying up storage costs and holding costs on shelf space you don't have to spare, a classic case of overstocking. Under-order and you understock, letting stock levels hit zero before the next delivery, 86'ing dishes and losing ticket revenue along with the customer loyalty a repeat guest represents. Either way, the mistake shows up in your food cost percentage with nothing to offset it.
What bad demand planning actually costs you in food cost % terms
Let's put numbers to it. "Food waste is expensive" doesn't move anyone to change behavior. Seeing it on a P&L does.
If you spend $15,000 a month on food and waste 8% of it (the industry range runs 4-10%), that's $1,200 a month in food cost with zero revenue attached. Pure loss. You bought it, you prepped it, you threw it away. That waste also ties up cash flow that could go toward payroll, marketing, or equipment.
Stockouts hit from the other direction. An 86'd entree on a Friday night loses the ticket, the table turn, and potentially a return visit. A single stockout on a busy night can easily cost $200 to $400 in combined lost revenue once you count the table turn, depending on your average check. Two or three per week adds up fast.
Now look at the upside. A 2-point reduction in food cost percentage, say from 34% to 32%, on $50,000 in monthly revenue saves $1,000 a month. That's $12,000 a year. Without touching labor. Without renegotiating rent. Just ordering more accurately. Otter's guide to restaurant accounting covers how food cost percentage and prime cost interact with your broader P&L if you want the fuller picture beyond this one lever.
That's what demand planning actually does. It's a direct lever on the same food cost % line you're already watching.
The historical sales data you already have and how to read it
Here's what most operators don't realize: you already have the data you need. It's sitting in your POS right now.
The three most useful cuts are:
- Sales by menu item: which dishes are actually moving
- Day-of-week sales: how volume shifts across the week
- Sales by daypart: what lunch looks like versus dinner versus late night
Those three together reveal patterns that a flat weekly total hides completely.
Take a chicken sandwich that moves 90 units a week. Sounds straightforward. But if 65 of those units sell at lunch and 25 at dinner, and you're ordering based on a blended weekly number, you'll run out at the lunch rush and have excess inventory sitting in the walk-in through dinner service. Simultaneously short and overstocked on the same item.
Day-of-week variation matters just as much. If Friday dinner consistently runs 40% higher than Tuesday dinner for a specific protein, that variance in customer demand should drive differentiated order quantities, not a blended weekly average that makes both days wrong.
Otter's POS captures item-level transaction data across every service period, giving you a granular, real-time data feed on demand without manual counting or separate tracking tools. You don't need to build a spreadsheet from scratch. You need to pull the right report and read it correctly.
"Another thing I love about Otter is the analytics side of it. On the back end, it is so easy to see the breakdown every single day, as well as the monthly sales, yearly sales. I'm able to compare this week to next week, see what days do better, what items are doing better. It just makes managing as a business owner so much better."
Christina Hong, owner of Seoulmates, Beverly Grove, Los Angeles, CA
One caution: distinguish signal from noise. A spike caused by a private buyout or a rainstorm that drove everyone inside isn't a demand trend. Build your forecasts on rolling 4-6 week averages of historical data and flag outlier days before you let them skew your par calculations.

How to set par levels based on what you'll actually sell
A par level is the minimum quantity of an item you need on hand at any point to cover demand until your next delivery arrives, plus a safety buffer for variance.
The formula is straightforward:
Par = (Average daily usage x Days until next delivery) + Safety stock
Concrete example: you use 10 lbs of ground beef, one of your core raw materials, per day. Your next delivery is 3 days away. You keep 1 day of safety stock as a buffer. Par = (10 x 3) + 10 = 40 lbs.
The mistake most operators make is setting one blanket par for everything and never revisiting it. That approach is the single biggest source of simultaneous stockouts and excess inventory. Different items have different usage rates, different delivery frequencies, and different spoilage windows. Pars need to be item-specific and delivery-window-specific, which is really just inventory control applied consistently instead of once.
Update pars dynamically. After a menu change, a seasonal shift, or a demand trend that holds for two or more consecutive weeks, rerun the calculation. Stale pars drive bad orders. Bad orders drive food cost problems. It's a direct line.
Working backward from your delivery window to size each order
Here's the mechanic most operators miss entirely. Instead of generating a sales forecast and hoping it maps to your purchasing calendar, start with your distributor's delivery schedule and work backward.
Four steps:
- Confirm your delivery day and order cutoff time. These are fixed. Everything else fits around them
- Define the coverage window. How many days from your current on-hand through and including the next delivery?
- Forecast item-level sales volume for that window using your POS day-of-week and daypart data, plus any demand calendar flags
- Calculate the order quantity: Forecasted demand for the window + Safety stock - Current on-hand = Order quantity
Concrete example: your order cutoff is Tuesday, delivery is Thursday, and you're covering Thursday through Saturday night service. Pull your POS data for those three days of the week. If you have 20 lbs of chicken on hand, need 60 lbs to cover the window, and want 10 lbs of safety stock, you order exactly 50 lbs.
You're not estimating a fuzzy weekly number. You're solving for a specific coverage window with actual demand data. That forces precision and surfaces errors in your par assumptions fast.
Cutoff times are non-negotiable. Missing a Tuesday cutoff means no Thursday delivery and a Saturday rush with whatever survived the week. Build the cutoff into a standing weekly routine.
Ordering cadence and distributor lead times
Most independent operators have 2-3 set delivery windows per week per distributor. Your demand plan has to align to those windows, not the reverse. Distributor lead times, the gap between when you place an order and when it arrives, are the frame everything else fits into.
Minimum order quantities (MOQs) add another constraint. Many distributors require a minimum dollar amount or case count per order. Understand how MOQs interact with your forecast so you're batching orders across categories to hit minimums without over-ordering any single perishable item.
Build a standing substitution list for your highest-turnover items. Backorders, short shipments, and substitutions happen regularly. A pre-approved substitute list means no one is scrambling at 10 a.m. before a lunch rush.
Price volatility is a planning input, not just a cost. Distributor prices fluctuate week to week on produce and proteins. A forecast-driven order protects against panic-buying at elevated prices and prevents "buying cheap" overstock that creates spoilage before you can use it, both of which damage cash flow.
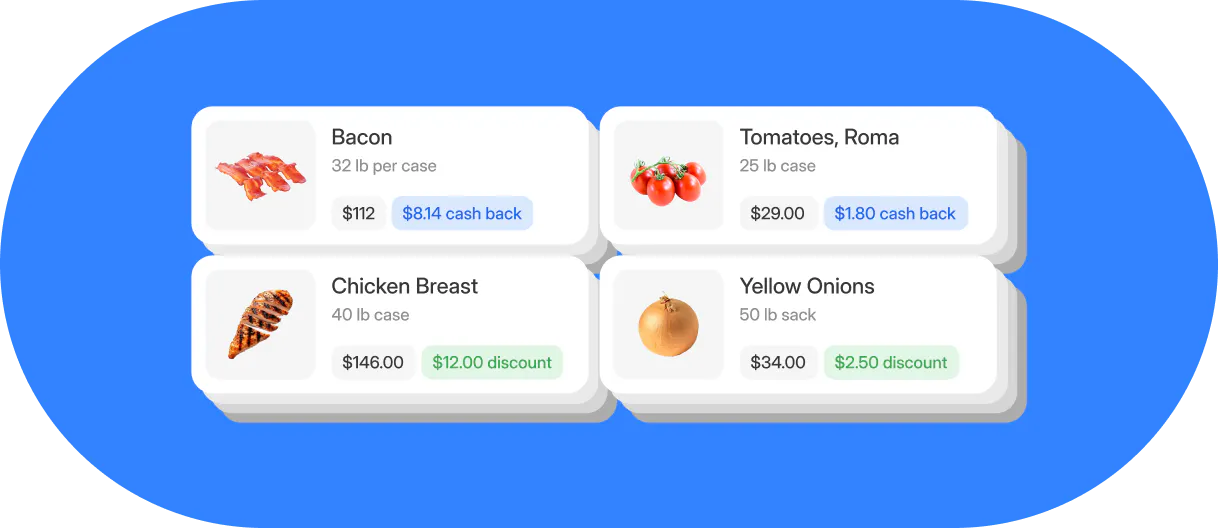
Operators who connect their existing distributors to Otter's Inventory Savings program can receive sourcing recommendations for same-quality, lower-priced alternatives. Savings typically surface within approximately 90 days as distributor pricing adjusts. It's a structural cost reduction that compounds on top of better demand planning, not a replacement for it. Otter's guide to restaurant supply chain management goes deeper on group purchasing, supplier relationships, and building the kind of contingency plan that keeps a single missed delivery from turning into a Saturday-night stockout.
Otter helps independent operators unlock sourcing discounts from their existing distributors, no new ordering workflow required.
The most common demand planning mistakes independent operators make
Over-ordering "just in case." It feels like risk management. It's chronic spoilage and a direct hit to cash flow. The 4-10% food waste range means this mistake is already showing up in your food cost % right now.
Ignoring daypart variation. Ordering a flat quantity for a protein that runs in both a lunch special and a dinner entree ignores a demand gap that can be 3x or more between services. You'll be short at lunch and long at dinner on the same item.
Failing to update pars after a menu change. If you add a dish, remove a dish, or permanently 86 an item, recalculate affected pars before the next order. Every day you wait, you're ordering based on a reality that no longer exists.
Treating all weeks as equal. An upcoming holiday weekend, a local event, or the predictable post-holiday slowdown makes your baseline forecast wrong before you even place the order. Check the demand calendar before you finalize quantities.
Keeping demand knowledge in one person's head. When the chef or owner who "knows" the ordering patterns is sick, on vacation, or leaves, that institutional knowledge walks out the door with them. A documented, data-driven process is the only protection.
Treating it like a factory production process when it isn't one. Dedicated demand planning software built on machine learning algorithms exists, and some larger, multi-location groups with full production schedules and an ERP system behind their commissary kitchen genuinely need it. Most independent operators don't. The manual routine below gets you most of the accuracy with none of the overhead, whether you're tracking raw materials by weight, by case, or by barcode.
A consistent weekly demand planning routine turns guessing into a system
You don't need specialized software to start. You need a repeatable routine you can run in under 30 minutes before placing orders.
- Pull last week's POS sales by item and by day (about 15 min). Identify top movers, flag unusual spikes or dips, and establish your baseline demand forecast for the coming coverage window
- Check the demand calendar (about 2 min). Note any upcoming events, holidays, or menu changes that should adjust the baseline up or down before you calculate quantities
- Run the delivery-window formula for your top 10-15 highest-cost items (about 10 min). Forecasted demand for the window + Safety stock - Current on-hand = Order quantity. Start with highest-cost items where accuracy has the most P&L impact
- Place orders against those quantities, not gut feel. Document what you ordered and actual usage post-delivery so each cycle refines your forecast accuracy and builds replenishment into a habit instead of a scramble
Operators who run this routine consistently for 8-12 weeks typically see measurable reduction in spoilage and stockout frequency. Par levels self-correct through iteration. The process gets faster and more accurate the longer you run it, because you're building a real demand history instead of guessing fresh every week. Think of it as production planning for a kitchen: raw materials come in, your prep list is the production process that turns them into finished goods, and this routine is what decides how much of that process to run each day.
The operators who get food cost under control build a process, not a habit
They're not necessarily smarter or better resourced. They pull the right POS data, account for seasonal demand and what's coming up on the calendar, apply the delivery-window formula, and place the order. Every cycle, the forecast gets a little sharper. Every cycle, the gap between what you ordered and what you actually used gets a little smaller.
That's the compounding effect of consistent demand forecasting. It's not dramatic in the first few weeks. But over 90 days, it shows up clearly in your food cost percentage, and it stays there.
Stop ordering on gut feel. Use the historical sales data you're already capturing to buy exactly what you'll sell, and let Otter help lower the cost of what you're buying.
FAQ about inventory management and demand planning
What is demand planning for a restaurant?
Demand planning for a restaurant is the process of forecasting how much of each menu item you'll sell over a specific time window and using that forecast to determine exactly how much of each ingredient to order. It relies on historical sales data adjusted for variables like day of week, daypart, upcoming events, and seasonal demand shifts.
How is demand planning different from inventory management?
Inventory management tracks what you currently have on hand. Demand planning determines what you need to order, before your next delivery, to cover forecasted sales without running out or over-buying. They work together: demand planning sets the order quantities; inventory management confirms what's already in the walk-in so you don't double-order.
What data do I need to start demand planning at my restaurant?
Start with three cuts of data from your POS: sales by menu item, day-of-week sales, and sales by daypart. A rolling 4-6 week average gives you a reliable baseline. Adjust that baseline for known upcoming variables (holidays, local events, menu changes) before calculating order quantities.
How do I calculate par levels for my restaurant?
Use this formula: Par = (Average daily usage x Days until next delivery) + Safety stock. Example: if you use 10 lbs of a protein per day, your next delivery is 3 days away, and you keep 1 day of safety stock, your par is 40 lbs. Recalculate any time your menu changes or a demand trend shifts and holds for two or more weeks.
How does better demand planning reduce food cost percentage?
Accurate demand planning cuts food cost in two directions at once: it reduces spoilage (you're not over-ordering perishables that rot before use) and it eliminates stockout losses (you're not 86'ing menu items and losing ticket revenue). Even a 2-point improvement in food cost % on $50K monthly revenue saves $12,000 a year.
Do I need demand planning software as an independent operator?
For most independent operators, the most practical starting point is your POS reporting, item-level sales by day and daypart, combined with the delivery-window ordering formula covered here. Dedicated inventory management software or demand planning software accelerates the process, but the underlying logic is the same whether you run it manually or with a tool.
How far in advance should I be planning restaurant orders?
Plan at minimum one full ordering cycle ahead, typically 3 to 7 days depending on your distributor lead times and cutoff schedule. For high-volatility perishables like produce and proteins, review on-hand levels twice per week. For shelf-stable items, a weekly review before each order is sufficient.
What is the single biggest demand planning mistake restaurant operators make?
Over-ordering "just in case." It feels like risk management but it drives spoilage directly into food cost % with no revenue to offset it. A close second is failing to update par levels the moment a menu item is added, removed, or repriced. Stale pars immediately create excess inventory or stockouts on affected ingredients.

Turn your POS data into smarter orders