Table of contents
- Where restaurant costs stand right now
- How is inflation affecting restaurant profit margins?
- How are small and independent restaurants affected differently than chains?
- How are restaurants adjusting purchasing and sourcing to manage food inflation?
- How are supply chains and tariffs still affecting restaurant costs?
- How should restaurants frame value when guests are price-sensitive?
- How is consumer behavior changing what restaurants offer?
- Which numbers to watch before you change a price
- Inflation is a margin problem, not a pricing problem
- Frequently asked questions about restaurant inflation
The average American restaurant now spends 36% more to operate than it did in 2019, and keeps a pre-tax profit of roughly five cents on the dollar. Those two numbers, both from the National Restaurant Association, explain most of what has happened to the industry since the pandemic, and they explain why raising prices has stopped working as a strategy.
The instinct when costs rise is to move prices to match. The arithmetic does not cooperate. On a five percent margin, a cost increase of that size does not need a price increase of that size, it needs a sales increase of that size, which is a different and much harder problem. That gap is the part of restaurant inflation that gets least attention and does the most damage. This article works through what inflation has actually done to the cost stack, why independents and chains are feeling it differently, and which decisions still move the number.
Key insights
- Inflation has hit restaurants as a total expense problem, not a food problem: food, labor and everything else all moved together, which is why cutting one line item rarely closes the gap.
- A restaurant operating on a five percent pre-tax margin needs a sales increase roughly equal to its expense increase just to hold that margin, which is why price rises alone do not restore profitability.
- Menu price inflation has slowed to roughly the same pace as grocery inflation for the first time in years, which removes the "eating out has gotten relatively more expensive" pressure but also removes the cover for further increases.
- The decisions that still move margin are purchasing consolidation, item-level menu rationalization, and knowing your real net per order after discounts and fees, not across-the-board price changes.
Where restaurant costs stand right now
These are the industry averages. The useful exercise is holding them next to your own P&L, because the places where you differ from the average are usually the places worth working on.
Cost and margin figures come from the National Restaurant Association. Price figures come from the Bureau of Labor Statistics' Consumer Price Index for July 2026, tracked month to month on the NRA's menu prices page.
Figure | Value | Period |
|---|---|---|
Total expenses, average restaurant | Up 36% | 2019 to 2026 |
Food cost, share of every sales dollar | About 33 cents | 2026 |
Labor cost, share of every sales dollar | About 33 cents | 2026 |
All other expenses combined | About 29% of sales | 2026 |
Typical pre-tax profit margin | About 5% | 2026 |
Sales increase needed to break even against 2019 | 29% | 2019 to 2026 |
Sales increase needed to hold a 5% margin against 2019 | 36% | 2019 to 2026 |
Menu price inflation, food away from home | 3.4% | 12 months to July 2026 |
Grocery price inflation, food at home | 2.7% | 12 months to July 2026 |
Full-service menu prices | 3.4% | 12 months to July 2026 |
Limited-service menu prices | 3.3% | 12 months to July 2026 |
Fastest regional menu inflation, Midwest | 3.7% | 12 months to July 2026 |
Slowest regional menu inflation, West | 3.1% | 12 months to July 2026 |
Two things in that table matter more than the rest. The expense increase and the margin sit in different orders of magnitude, which is the whole problem. And menu price inflation has now converged with grocery inflation, which changes the competitive picture for the first time since 2021.
How is inflation affecting restaurant profit margins?
Inflation compresses restaurant margins because the cost base moved far more than prices did, and because the margin it is compressing was thin to begin with. A typical restaurant keeps about five cents of pre-tax profit per dollar of sales, while its total operating expenses have risen by more than a third since 2019. There is not enough margin underneath the cost increase to absorb it.
The scale of the mismatch is easier to see as a sales target than as a percentage. Running the same restaurant at 2019 sales volume with 2026 costs produces a substantial pre-tax loss. Breaking even requires selling meaningfully more than in 2019, and holding the old five percent margin requires selling more still. Those thresholds are in the table above, and they are the reason operators who raised prices in line with their costs still found themselves less profitable: they solved for revenue per cover, when the shortfall was in total volume.
Why the cost increase is not a food-cost story
Food and labor each consume roughly a third of every sales dollar, and everything else, meaning utilities, occupancy, supplies, general and administrative, repairs and maintenance, and card processing fees, takes up most of what remains. That distribution is the reason single-lever cost cutting disappoints. Removing a few points from food cost is real money, but it is a few points against a cost base where two thirds of the pressure sits somewhere else.
It is also why the industry conversation about "food inflation" understates the problem. Groceries and menu prices get tracked monthly and reported widely. Rent, insurance and card fees do not, and they moved too. If you want to see where your own version of this sits, Otter's breakdown of restaurant profit margins walks through the full expense stack rather than food alone.
Why prices stopped being the answer
Menu price inflation and grocery inflation have converged, with restaurant prices now rising only modestly faster than supermarket prices over the past year. For four years, restaurants had room to raise prices because groceries were rising just as fast and diners were absorbing increases everywhere. That cover is gone. Raising prices into a slowing price environment is now a market-share decision, not a cost pass-through.
How are small and independent restaurants affected differently than chains?
Independents feel food inflation more sharply than chains because they buy at lower volume, hold less pricing power with distributors, and lack the contract terms that smooth price movement over time. A national chain negotiates annually across hundreds of locations and often locks pricing for a defined period. A single-location operator generally takes the market price on the invoice that arrives this week.
The second difference is analytical rather than financial. Chains run category management teams whose job is to notice that one ingredient moved four percent and to re-spec the dish before it reaches the P&L. Independents usually discover the same movement a month later, in a monthly cost of goods number that has drifted without an obvious cause. The cost increase is similar. The lag before anyone acts on it is not.
The third is the balance sheet. Chains can absorb a bad quarter and wait for input prices to normalize. Most independents cannot, which forces faster and often worse decisions: a price rise made under pressure rather than one planned against a sales mix.
None of this makes the gap unclosable, and the analytical gap is the one that is genuinely cheap to close. Tracking cost of goods at item level rather than at invoice level is a reporting decision more than a budget decision. Otter's guide to calculating restaurant food cost covers the mechanics of getting there.
How are restaurants adjusting purchasing and sourcing to manage food inflation?
Operators are responding to food inflation mostly on the buying side rather than the selling side, because purchasing changes do not have to be explained to a guest. The four moves that show up consistently are consolidating spend with fewer distributors, joining a group purchasing organization, re-specifying dishes toward ingredients whose prices are stable, and shortening the interval between re-costing a recipe and acting on the result.
Consolidating spend
Splitting orders across several distributors feels like it protects against price spikes. In practice it reduces the volume you place with any one of them, which is the only lever that earns better terms. Consolidating spend with fewer suppliers, then negotiating on that combined volume, is usually worth more than the spread you were chasing. It also cuts the administrative load of reconciling multiple invoice formats every week.
Buying through a group purchasing organization
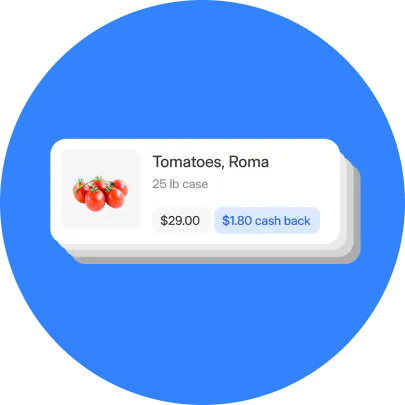
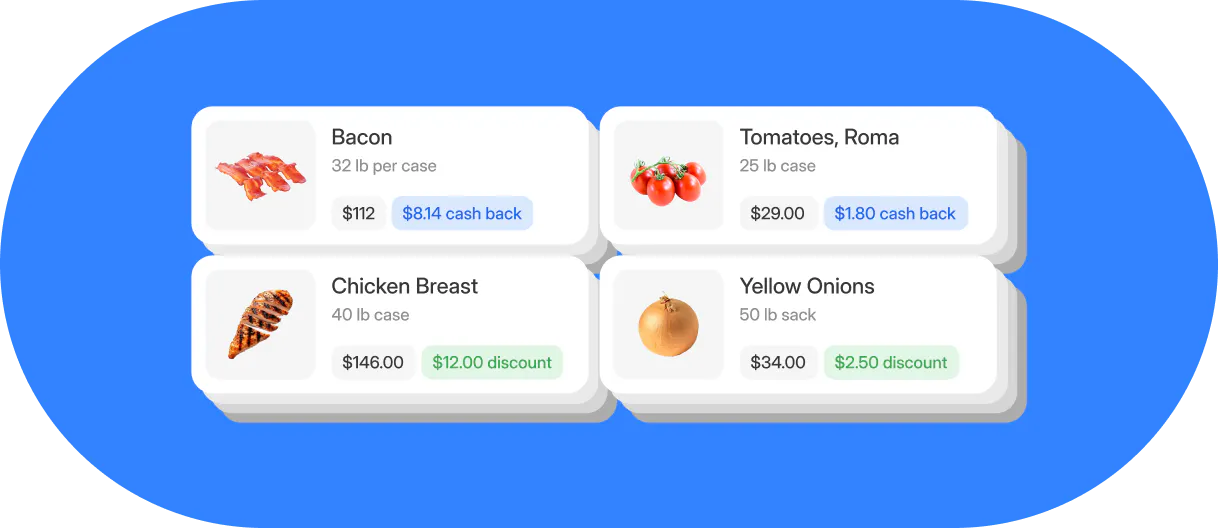
Group purchasing lets independents buy at volumes they do not individually have, by aggregating orders across many operators. The distributors and the order patterns stay the same, and the saving arrives as a rebate against what was already being spent. This is what Otter Inventory Savings does: it puts independent restaurants into a group purchasing agreement without changing suppliers or ordering habits. For most operators it is the rare cost lever that requires no operational change at all.
Re-specifying rather than re-pricing
When an ingredient moves, the reflex is to raise the price of the dish that contains it. Often the better move is to change the dish. Substituting toward domestically produced or seasonally abundant ingredients, adjusting a garnish, or changing a protein cut can recover the same margin without touching the menu price, which is the number the guest is watching. This works only if you know the per-dish cost precisely enough to see what changed, which is why the re-costing interval matters as much as the re-costing itself. Otter's guide to menu costing sets out specific triggers for when to re-cost rather than a vague instruction to review regularly.
Shortening the reaction time
The difference between a well-run and a badly-run response to input inflation is mostly latency. A supplier price change above roughly a few percent should reach the recipe card within a week, not at the next quarterly menu review. Operators who buy through consistent channels and track landed cost per item can act on that timescale. Those working from monthly totals cannot see the movement until it has already cost them. Otter's overview of restaurant supply chain management covers how to structure ordering so the data arrives in time to be useful.
How are supply chains and tariffs still affecting restaurant costs?
Tariffs affect restaurant costs through two channels that behave differently. The direct channel is imported food: coffee, cocoa, spices, seafood, cheese, olive oil and out-of-season produce, where a duty lands more or less immediately on the invoice. The indirect channel is everything else the kitchen consumes, meaning equipment, smallwares, packaging, and the aluminium and steel inside both. That second channel moves slower and is easier to miss, because it shows up in capital and supplies budgets rather than in food cost.
The policy position on the direct channel changed materially in late 2025, when an executive order lifted tariffs on a list of food categories including coffee, tea, cocoa, spices, tropical fruit and juice, bananas, oranges, tomatoes and beef. Other categories, including wheat, dairy, pork, poultry and most vegetables not named in that order, remained subject to duties. The practical lesson for operators is not the specific list, which will change again, but the exposure map: know which of your top ingredients by spend are imported, and from where, so that the next policy move takes you an afternoon to model rather than a quarter to notice.
Supply availability is the other half of this. Tariffs and trade friction change not just what ingredients cost but how reliably they arrive, and an ingredient that is intermittently unavailable is more expensive than its price suggests once you count the substitutions, the reprints and the disappointed guests. Menus built with deliberate ingredient overlap absorb that better than menus where every dish depends on something unique. Keeping availability in step across every channel you sell on matters here too, which is what Otter Menu Management handles when an item has to come off at short notice.
How should restaurants frame value when guests are price-sensitive?
Value framing works when it gives a guest a reason to believe the price is fair, and fails when it reads as an apology for the price. The distinction matters more in an inflationary period than at any other time, because guests are actively auditing whether each visit was worth it, and because the alternative they are comparing against, cooking at home, has stopped getting relatively cheaper.
Three approaches hold up. The first is making the basis of the price visible: portion size, ingredient sourcing, preparation method, anything that answers the unspoken question about where the money went. The second is offering a genuine entry point rather than discounting the whole menu, so a price-sensitive guest has a way to visit without you cutting the margin on everyone who was happy to pay. The third is rewarding frequency instead of cutting price, which protects margin on the guests you already have. A well-run rewards program does this without touching list prices, and Otter Loyalty is built around repeat visits rather than blanket discounting.
What does not hold up is quiet portion reduction. Guests notice, they discuss it publicly, and the reputational cost outlasts the margin recovery. If a portion has to change, changing it openly alongside a visible reason performs better than hoping nobody measures.
For operators considering time-based or demand-based pricing as an alternative to across-the-board increases, Otter's analysis of dynamic pricing for restaurants covers where it works and where it backfires.
How is consumer behavior changing what restaurants offer?
Sustained price sensitivity has pushed demand toward formats with a lower cost of trial. Guests are eating out somewhat less often and being more deliberate when they do, which favors the restaurants they already trust over the ones they have not tried. That is a retention market rather than an acquisition market, and it rewards operators who can identify and reward their regulars over those spending to attract new ones.
It has also changed what a menu needs to contain. Demand has concentrated toward the accessible end of most menus, which means the tail of expensive, slow-moving items is now carrying less revenue while still consuming prep time, storage space and ingredient variety. Cutting that tail is usually the highest-return menu decision available, and it is a decision that requires item-level sales data rather than intuition about which dishes people like.
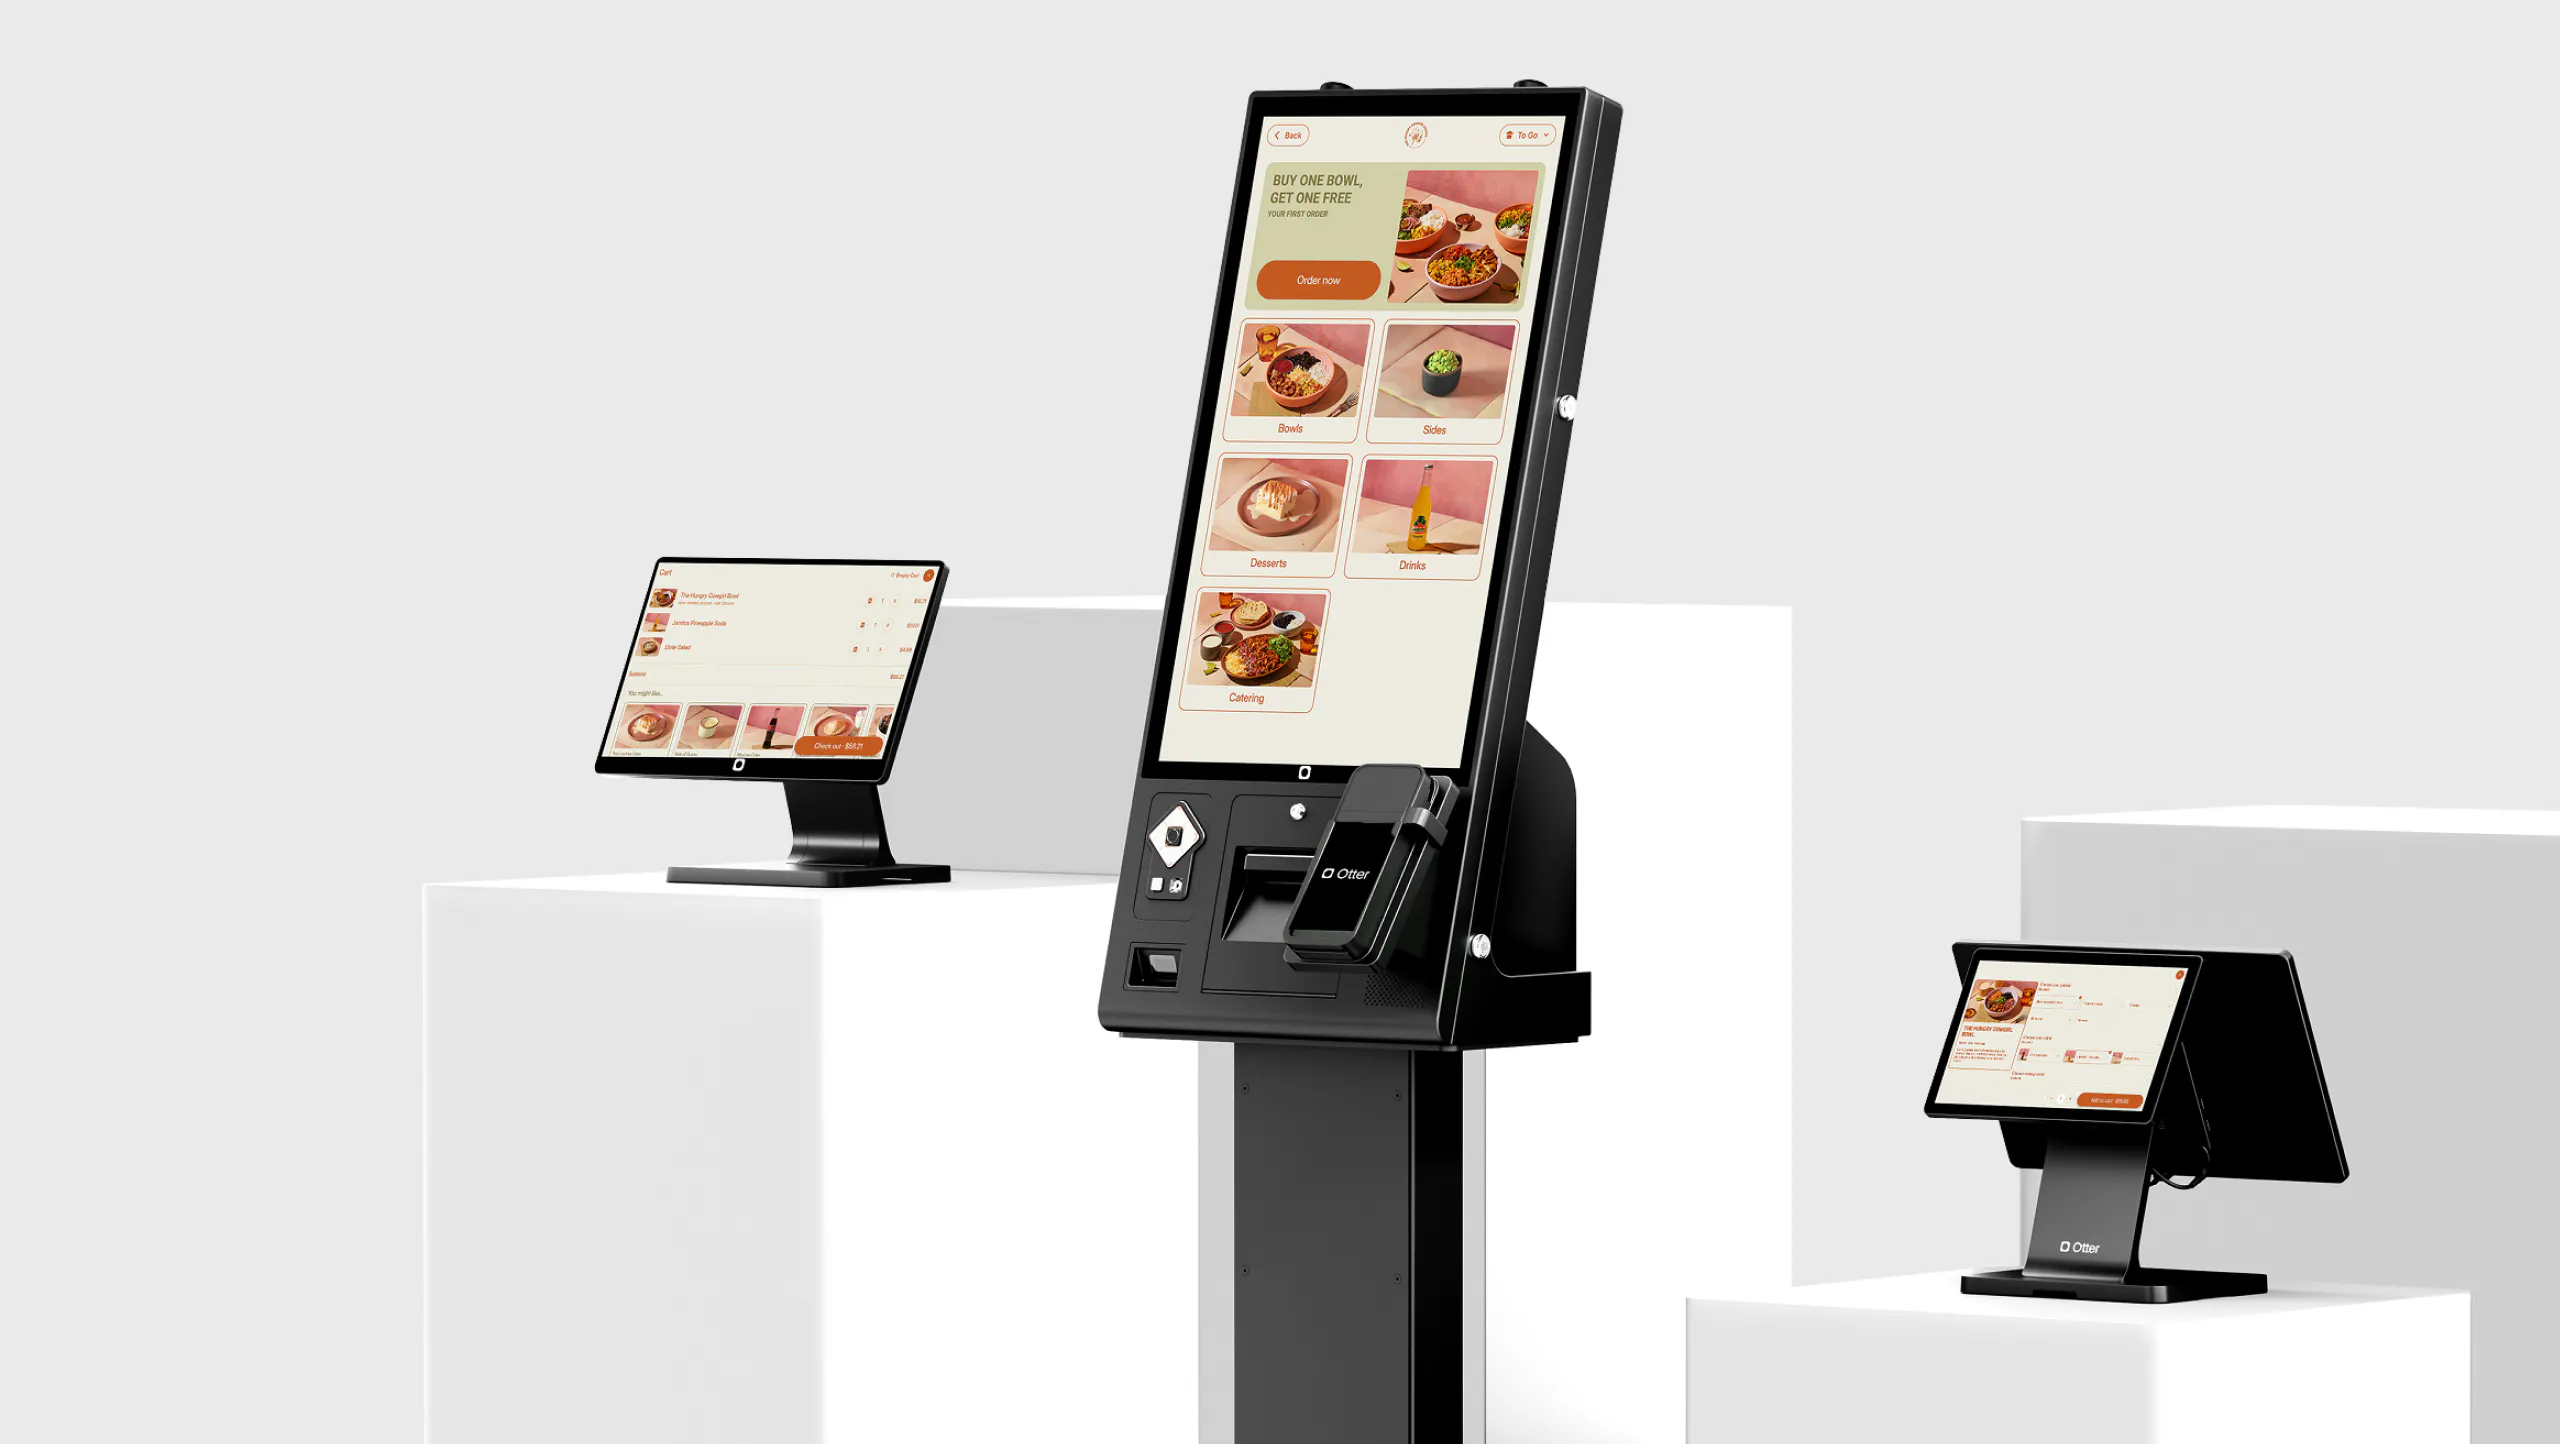
Labor is the third pressure. Where guest counts are flat but wages are not, service models that hold throughput without adding headcount become more attractive, which is much of why self-service kiosks keep expanding in quick-service formats. The economics are less about replacing staff than about not needing an extra person at the counter during the ninety minutes a day when the line is long.
Which numbers to watch before you change a price
Before adjusting any price, three numbers should be current: cost per dish at item level, contribution margin by item ranked from best to worst, and net revenue per order after discounts, delivery commissions and processing fees. Most repricing decisions go wrong because the third number is unknown, so an item that looks profitable on the menu is losing money on the channel where most of it sells.
The item-level ranking is the one that most often changes a decision. It typically shows that a handful of dishes are earning almost nothing after their true cost, and that removing them does more for the margin than a general price increase would.
"I like your guys' reporting. Specifically the product mix report, it tells us what we've sold the most for the day, to the least. We got Otter back in May, and since then we've cut out three items that were really just costing us money to have on the menu. I feel that has been beneficial."
Nicoletta Kuti, co-owner, Telly's Charburgers, Santa Clarita, California
That is the pattern in miniature: not a price change, a menu decision made visible by data that was previously scattered across channels. Otter Analytics reports product mix and net revenue across every ordering channel in one place, and because Otter POS captures in-store, delivery and pickup orders on the same system, the channel comparison is like for like rather than stitched together from separate reports.
If you want a benchmark to test your own numbers against before making changes, Otter's monthly food cost benchmarks set out what typical looks like by service format.
Inflation is a margin problem, not a pricing problem
The most useful reframe available to an operator right now is that inflation did not make the restaurant more expensive to visit, it made it more expensive to run. Those are different problems with different solutions, and the pricing lever only addresses the first one.
The operators handling this well are not the ones who raised prices most cleverly. They are the ones who found out precisely where their margin was going, ingredient by ingredient and channel by channel, and then made a small number of unglamorous decisions: consolidate the buying, cut the items that were never earning, price the ones that were, and reward the guests who come back. None of that requires the cost environment to improve. That is the point of doing it.

Book a demo with Otter
It’s time to enhance your operations with Otter’s all-in-one restaurant platform. Book time with our sales team to learn more.
Frequently asked questions about restaurant inflation
How much have restaurant prices gone up?
Menu prices rose 3.4% over the twelve months to July 2026, according to the Bureau of Labor Statistics, with full-service restaurants at 3.4% and limited-service at 3.3%. Grocery prices rose 2.7% over the same period. That gap between eating out and eating at home is the narrowest it has been in several years, meaning restaurant prices are no longer pulling away from supermarket prices the way they did between 2021 and 2024.
Why are restaurant prices rising faster than my food costs?
Because food is only about a third of a restaurant's expenses. Labor takes a similar share, and utilities, rent, insurance, supplies and card processing fees make up most of the rest. Menu prices reflect movement across all of those, not just the invoice from the food distributor, which is why menu inflation can run ahead of ingredient inflation without anyone profiteering.
What is a normal profit margin for a restaurant right now?
Around 5% pre-tax for a typical restaurant, per the National Restaurant Association. Well-run limited-service operations can run higher and full-service restaurants in high-rent locations often run lower. The important implication of a 5% margin is how little room it leaves: a cost increase of a few percentage points of sales can erase most of the profit, which is why operators track contribution margin by item rather than only watching the overall percentage.
Are tariffs still raising restaurant food costs?
Partly. An executive order in late 2025 removed tariffs on a range of food imports including coffee, tea, cocoa, spices, tropical fruit, bananas, oranges, tomatoes and beef. Wheat, dairy, pork, poultry and most other vegetables remained subject to duties, as did the imported equipment, packaging and smallwares that restaurants buy outside their food spend. Because this changes with policy rather than with markets, the practical step is knowing which of your highest-spend ingredients are imported and from where, so you can model the next change quickly.
Should I raise menu prices to cover inflation?
Only after you know which items can carry an increase. A general price rise applied across a menu raises prices on items that were already profitable and on items that were not, and it does nothing about the ones losing money on delivery channels after commissions. Ranking items by contribution margin first usually reveals that removing or re-specifying a few dishes recovers more margin than a broad increase would, and without giving guests a reason to reconsider the visit.
How can technology help a restaurant deal with inflation?
Mostly by shortening the gap between a cost changing and someone noticing. Item-level reporting shows which dishes stopped being profitable, consolidated channel reporting shows true net revenue after fees and commissions, and group purchasing programs recover cost on food you are already buying. None of that lowers the price of an ingredient. It changes how quickly you can respond when the price moves, which is where most of the recoverable margin actually sits.

Protect your margin with Otter Analytics