
Table of contents
- What a restaurant budget actually is (and what it isn't)
- Gather your numbers before you build anything
- Map every cost: fixed, variable, and the ones you're probably missing
- The two numbers that make or break your restaurant: food cost and labor cost
- How to forecast revenue when you're not starting from zero
- Build the budget: a line-by-line monthly walkthrough
- The 15-minute Monday check-in that makes your budget actually stick
- Budget mistakes that quietly drain independent restaurants
- A budget you check every Monday is worth ten times over one you open every December
- Frequently asked questions about restaurant budgeting
Knowing your break-even point is not the same as having a financial plan. Break-even tells you when you stop losing money. It says nothing about how you make it. And with restaurant net profit margins averaging just 3 to 6% of sales, the cushion between “open” and “profitable” is thin enough that a single bad month without a budget can quietly erase a quarter of good ones.
Consider this your restaurant budgeting 101: build a real restaurant budget from scratch, including what to do when your records are incomplete, and how to turn it into a weekly habit that catches problems before they compound. You can copy the structure below into a simple restaurant budget template and reuse it every month.
Key insights
- Prime cost (food plus labor) should stay at or below 65% of revenue. If your annual sales are under $1 million, push it toward 55 to 60% to have enough margin left after rent and overhead costs.
- Third-party delivery commissions (15 to 30% per order) fundamentally change your food cost math. Budget delivery revenue and in-house revenue as separate lines, or your margin picture will always look healthier on paper than it does in your bank account.
- A budget reviewed weekly catches a three-point food cost creep before it becomes a ten-point problem. Checking three numbers every Monday, food cost percentage, labor hours, and revenue vs. forecast, takes 15 minutes.
- If your records are incomplete, your POS system transaction history is the most reliable baseline you have. Daily and weekly sales data broken down by channel and daypart gives you a real foundation for sales forecasting without requiring separate restaurant accounting software.
What a restaurant budget actually is (and what it isn't)
A restaurant budget is a fixed financial plan you set before a period starts. It captures your revenue targets, your cost of goods sold (COGS), your labor cost percentage, your rent, your delivery commissions, all locked in as goals before the month begins.
A forecast is different. It is a live, rolling estimate of where you will actually land based on what has happened so far. You update it as the weeks unfold. Good forecasting turns your budget from a static target into something you can steer by.
A budget sits alongside your broader restaurant accounting, but it is forward-looking where accounting is a record of what already happened. The difference between budget vs. forecast matters in practice: the budget is your annual guardrails, the forecast is your weekly steering wheel. Neither replaces the other.
One more thing worth saying plainly: budgets are not just for chains. Independent operators and ghost kitchen owners have fewer cash reserves to absorb surprises, which makes a budget more critical, not less. If something goes sideways at a 20-location chain, they have breathing room. You probably do not.
Gather your numbers before you build anything
Before you open a spreadsheet, collect four things:
- POS sales history: at least 90 days if it exists
- Supplier invoices: every food and beverage purchase in the last 60 to 90 days
- Payroll records or a recent labor schedule: actual hours worked and wage rates
- Lease and fixed-cost agreements: rent, insurance, loan payments, software subscriptions
Most budgeting guides assume you have a tidy profit and loss statement to pull from. Many independent operators, newer owners, and ghost kitchen operators do not. Here is how to build a usable baseline when records are thin:
- Revenue proxy: Use your credit card settlement deposits and cash deposit totals from the last 60 to 90 days. Not perfect, but close enough to start.
- Food cost estimate: Add up the last 60 to 90 days of supplier invoices and divide by the revenue proxy. That is your current food cost percentage, rough as it may be.
- Labor estimate: Take a recent weekly schedule, multiply hours by wage rates, and add 10 to 15% for employer payroll taxes. That is your weekly labor cost.
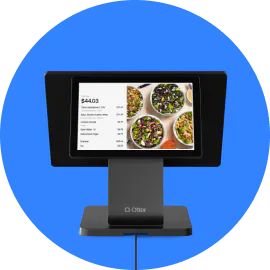
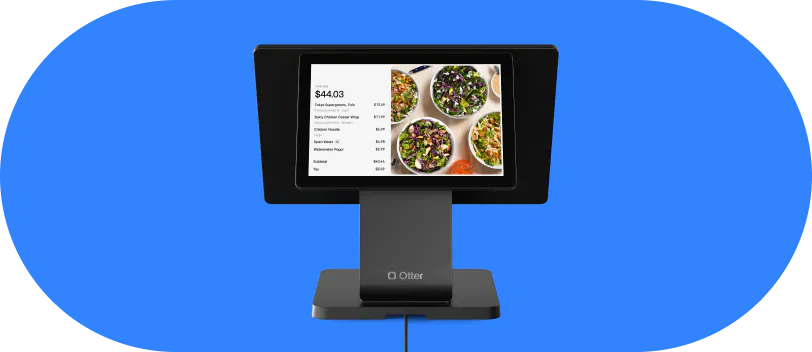
If you run Otter POS as your POS, you can pull daily and weekly sales broken down by daypart and channel directly from the system. That transaction history becomes the foundation for sales forecasting without needing separate accounting software.
If you are brand new with zero history, use industry benchmarks as starting estimates: food cost 28 to 32%, labor 28 to 35%. Replace them with your own data after the first 30 to 60 days of operation. One month of data can be skewed by a holiday week or an unusually slow stretch. Aim for at least three months of historical data before you trust any single number.
Map every cost: fixed, variable, and the ones you're probably missing
Fixed costs
These fixed costs do not change whether you serve 80 covers or 400:
- Rent or mortgage
- Property and liability insurance
- Business and liquor licenses
- Loan or equipment lease payments
- Salaried manager wages
- POS and software subscription fees (see what a POS system typically costs)
- Equipment depreciation, the value your kitchen equipment loses over time
Variable costs
These scale directly with volume:
- Hourly labor wages
- Food and beverage costs (COGS, your cost of goods sold)
- Single-use packaging and supplies
Semi-variable costs
These semi-variable costs are partly fixed, partly usage-driven:
- Utilities (a baseline even on slow weeks, higher when volume climbs)
- Repairs and maintenance
The line most operators miss
If you run a fast-casual, QSR, or ghost kitchen concept with meaningful delivery volume, third-party delivery platform commissions must be a named line item in your budget. These fees run 15 to 30% of the order value. Burying them in “other expenses” is how you end up confused about why your food cost percentage looks fine but the bank account does not.
After a 25% commission, the food cost math is entirely different from in-house sales. The standard 28 to 35% food cost benchmark assumes you keep the full ticket.
Other commonly forgotten operating expenses:
- Credit card processing fees (roughly 2.5 to 3.5% of card sales)
- Hood cleaning and pest control
- Uniforms
- Marketing and promotion spend, including social media ads and loyalty programs
Practical exercise: Pull the last 90 days of bank statements. Flag every ACH pull and every check written. Every line of income and expenses belongs in your budget.
The two numbers that make or break your restaurant: food cost and labor cost
Food cost percentage
Formula: (COGS ÷ food sales) × 100
Target: 28 to 35% for most QSR and fast-casual formats. If a significant share of your revenue flows through delivery platforms, aim for the lower end, or below 30%, to offset commission drag before those fees are counted separately. Many operators set an ideal food cost for each dish, then compare it against their actual food cost each week to spot waste.
Quick weekly check: Divide last week's food purchases by last week's food sales. You do not need to wait for month-end. This is the fastest early-warning signal in your budget.
Labor cost percentage
Formula: (total labor costs ÷ total revenue) × 100
Target: 25 to 35%. Always include hourly wages plus employer payroll taxes plus any benefits. Never budget only gross wages. A rising minimum wage in many states pushes this number up, so revisit it whenever local wage laws change.
Employer-side FICA alone is 7.65% on top of gross wages. Add FUTA and your state's unemployment insurance rate (SUTA) and you are looking at 10 to 15% on top of every dollar of gross wages. Operators who skip this consistently run over the labor line every single period. The surprise usually hits the first time a quarterly payroll tax deposit is due.
Prime cost
Prime cost = food cost + total labor cost
This is the single most important line in your budget. Target: at or below 65% of revenue for most concepts. According to industry benchmarks, if your annual sales are under $1 million, you often need to push toward 55 to 60% to have enough margin left after rent and other operating expenses. Keeping prime cost in range is what protects your profit margins.
How to forecast revenue when you're not starting from zero
Revenue forecasting means setting a realistic sales target for each month before it starts. Not hoping this month beats last month. So how do you do that accurately?
Use your POS sales data to calculate average weekly revenue, then break it down by daypart (breakfast, lunch, dinner, late night) and by channel (in-house vs. delivery). These two cuts tell you where your revenue actually comes from and which parts of the day are carrying the week.
Make seasonal adjustments. Identify your two or three slowest months and two or three peak months from prior-year data. If you are new, ask your food distributor rep about local seasonal patterns. They see volume trends across dozens of accounts in your market, and that context is free. Building seasonality into your numbers keeps a slow January from catching you off guard.
Always forecast delivery revenue and in-house revenue as separate lines. The food cost margin, labor demand, and net income per dollar are structurally different across channels.
Build three scenarios per month:
- Conservative: revenue down 10 to 15% from base
- Base: flat to prior comparable period
- Optimistic: up 10 to 15%
Budget to the conservative case. Manage operations toward the base. If you hit optimistic, that is a good problem.
Otter's analytics surfaces sales by channel and daypart, giving you a clean data export to anchor monthly revenue forecasts without building a separate tracking spreadsheet from scratch. Operators use that same view to keep an eye on where money is leaking out of each ticket.
“One thing that has been really helpful is the breakdown of the different discounts and service fees and all things like that, so I can see where all the money's going, what the net is. It's just really easy to read and manage.”
Christina Hong, owner of Seoulmates, Los Angeles
Build the budget: a line-by-line monthly walkthrough
Here is the sequence, one step at a time:
- Enter forecasted monthly revenue: separate rows for in-house and delivery channels
- Subtract COGS: apply your target food cost percentage to each revenue line separately, not blended across channels
- Subtract labor: project hours from the schedule, multiply by average wage rate, add 10 to 15% for employer payroll taxes, add any salaried labor
- Subtract fixed operating expenses: rent, insurance, licenses, the same figure every month
- Subtract variable operating expenses: delivery platform commissions (as a percentage of delivery revenue), credit card processing fees, utilities, marketing spend
- Calculate net operating income: revenue minus all of the above. This is the number you manage toward each month.
Cash flow flag: A profitable month on paper can still leave you short on payroll if a large quarterly insurance premium lands the same week as a slow revenue stretch. At the start of the year, flag every irregular big payment (annual insurance renewals, quarterly tax deposits, equipment lease balloons) in your budget calendar so you see them coming. Protecting cash flow is as important as hitting your profit target.
The 15-minute Monday check-in that makes your budget actually stick
Every guide describes what a budget is. Almost none describe how you actually check it when you have no bookkeeper on retainer. Here is the habit.
Three numbers, every Monday morning:
- Last week's actual food cost percentage vs. the budgeted percentage
- Last week's total labor hours vs. the projected hours in the schedule
- Last week's actual revenue vs. the weekly revenue target from the forecast
When food cost spikes: Check for waste, spoilage, theft, or over-ordering before assuming ingredient prices went up. Inflation on key ingredients is real, but confirm it before you raise menu prices. Adjust the next purchase order immediately.
When labor is over: If you are two or three hours over budget for one slow week, tighten next week's schedule. If you are consistently over, the schedule template itself needs a structural revision. Not just a weekly patch.
The declining budget concept: Start each month with your total budgeted expense pool. Subtract actual spend each week and watch what is left. This makes overspending visible before it compounds into a month-end crisis.
Mid-month red flag: If your food cost percentage is running five or more points above budget by the end of week two, you will not recover by month-end without an active intervention: a price adjustment, a menu change, or a supplier conversation. Waiting until the end of the month to notice is how a three-point problem becomes a ten-point one.
This check-in should take no more than 15 minutes. You need a POS report and a single spreadsheet. That is it.
Budget mistakes that quietly drain independent restaurants
Mistake 1: Budgeting gross wages without payroll taxes
FICA, FUTA, and state unemployment taxes add 10 to 15% on top of gross wages. Operators who forget this are over the labor line before the first week is done.
Mistake 2: Under-budgeting delivery commissions.
If 40% of your revenue comes through a third-party platform at 25% commission, that is 10% of total revenue disappearing before food or labor is counted.
Mistake 3: Treating the budget as a once-a-year document
A budget set in January and not revisited until December is a historical record, not a management tool. Build in monthly reviews and make seasonal adjustments as conditions change.
Mistake 4: Skipping a cash flow projection
A profitable month on paper can still leave you short on payroll if a large invoice lands the same week as a slow weekend. Sound financial planning maps timing, not just totals.
Mistake 5: Applying benchmarks without adjusting for your concept
A ghost kitchen with heavy delivery volume cannot use the same prime cost math as a counter-service QSR with no commissions. The food and beverage costs targets are structurally different.
Mistake 6: Blending in-house and delivery revenue into one line
This hides where the margin lives and makes your food cost percentage look better than it really is.
A budget you check every Monday is worth ten times over one you open every December
The goal of a restaurant budget is not to predict the future perfectly. It is to shorten the distance between when something goes wrong and when you find out about it.
A weekly check catches a three-point food cost creep before it becomes a ten-point problem. A monthly review catches it too late to recover within the period. An annual review catches it after the damage is done.
Because Otter is your POS, daily and weekly sales data broken down by channel and daypart is already in the system. Pulling last week's revenue numbers for a Monday check-in requires no extra software and no manual data entry. Otter can also surface sourcing and distributor discount opportunities through Otter Inventory Savings that reduce your COGS over time. Plan for roughly a 90-day lag before those savings show up in the food cost line, so budget conservatively in the near term.
The operators who stay profitable are not the ones who work the most hours. They are the ones who know their numbers every week and act on them before small variances become big losses.
Want the sales data foundation a real restaurant budget needs? See Otter in action.
Frequently asked questions about restaurant budgeting
How much should a restaurant budget for food costs?
Most QSR and fast-casual restaurants target food cost (COGS) between 28% and 35% of food revenue. If a significant portion of your sales flows through third-party delivery platforms, aim for the lower end, or even below 30%, to offset the 15 to 30% commission fees that come out of every delivery order before food cost is counted.
What is prime cost and why does it matter for budgeting?
Prime cost is your food cost plus your total labor cost combined. It is the single most important number in a restaurant budget because it captures your two biggest expenses in one figure. A healthy prime cost runs at or below 65% of revenue. If your annual sales are under $1 million, push it closer to 55 to 60% to have enough margin left after rent, utilities, and other operating expenses.
How often should I update my restaurant budget?
Set the annual budget once at the start of each fiscal year. Then review actual results against the budget every month, and run a quick three-number check every week: actual food cost percentage, actual labor hours, and actual revenue vs. forecast. A budget you check weekly is a management tool. One you check annually is just a historical document.
What is the difference between a restaurant budget and a forecast?
The budget vs. forecast distinction is simple but important. A budget is a fixed financial plan, the revenue and expense targets you commit to before the period starts. A forecast is a live, rolling estimate of where you will actually land based on what has happened so far. You need both: the budget keeps you honest about goals, the forecast tells you in real time whether you are on track to hit them.
How do I create a restaurant budget if I have no sales history?
Start with industry benchmarks: food cost 28 to 32%, labor 28 to 35%, rent under 10% of projected revenue, prime cost under 65%. Estimate revenue by multiplying projected weekly transactions by your average ticket size. After your first 30 to 60 days of operation, replace every benchmark with your own actual POS data and tighten each line from there.
Should I budget delivery revenue separately from in-house sales?
Yes, always. Third-party delivery platforms charge 15 to 30% commission per order, which changes your effective food cost percentage, your net margin per revenue dollar, and your labor demand. Blending delivery and in-house revenue into a single line hides where your margin actually lives.
What fixed costs should every restaurant budget include?
At minimum: rent or mortgage, property and liability insurance, business and liquor license fees, salaried manager wages, loan or equipment lease payments, and POS or software subscription fees. These fixed costs are the same every month regardless of volume.
How do I account for payroll taxes in my restaurant labor budget?
Add 10 to 15% on top of gross wages to cover employer-side payroll taxes: FICA (7.65%), Federal Unemployment Tax (FUTA), and your state's unemployment insurance rate (SUTA). Operators who budget only gross wages consistently run over the labor line. The surprise usually hits the first time a quarterly payroll tax deposit is due.

Ready to put real numbers behind your plan? Book a demo