
Table of contents
- What percentage of revenue should a restaurant spend on marketing?
- Restaurant marketing budget benchmarks by revenue tier
- Set your goal before you set your budget
- The marketing spending ladder: what to fund first
- How to split your budget across channels
- Use your own sales data to decide where to spend
- Hidden costs most operators forget to budget for
- How to track whether your marketing is actually working
- Restaurant marketing budget mistakes that cost real money
- Precise targeting beats a bigger budget every time
- Frequently asked questions about restaurant marketing budgets
You know you need to spend on marketing. You just don't know how much. Spend too little and your ads are invisible. Spend too much without a plan and you're handing cash to channels that never pay back.
Restaurant and foodservice sales are projected to reach a record $1.55 trillion in 2026, according to the National Restaurant Association. That means more restaurants competing for the same customer dollars than ever before. Standing still is not a neutral choice.
This article walks you through the decision from start to finish: how much to budget by revenue tier, what to fund first, and how to use your own sales data to set your marketing spend percentage and place every dollar. It's the budgeting core of your restaurant marketing plan and a solid marketing strategy you can apply immediately.
Key Insights
- The 3–6% rule is a floor, not a strategy, so translate it into a monthly dollar amount for your specific revenue tier before you contact a single vendor or agency.
- Underfunding kills campaigns just as surely as overspending: $300/month spread across five channels means none of them hit the threshold to work; concentrate spend before you diversify.
- Your POS data (daypart volume, new vs. repeat customers ratio, order channel mix) is more useful for setting a marketing budget than any industry percentage, because it shows you exactly where the revenue opportunity is.
- Always budget 15–20% above your planned media spend to cover hidden costs: food photography, content creation, freelancer fees, and the cost of goods behind every promotional offer.
What percentage of revenue should a restaurant spend on marketing?
The widely cited benchmark: established restaurants should spend 3–6% of gross revenue on marketing. New restaurants building awareness from zero typically need 6–10% to build early traction.
That range is a starting point, not the full story. Your business stage, local competition, and growth goals all shift the number. An eight-year-old neighborhood spot with a loyal base and a packed Friday dinner service can sustain a lower marketing spend percentage. A fast-casual that opened six months ago in a competitive corridor needs to be at the high end, or above it, until brand awareness is built.
The operator who spends 0.2% because "we're busy enough" is fine right up until a new competitor opens across the street. Treat the percentage as a floor, not a ceiling.
Two situations call for different approaches:
- Deep organic loyalty: regulars come back without prompting, word-of-mouth is strong, and the local market is not saturated. A 3–4% rate can hold the business.
- Actively growing: new location, new concept, new delivery channel, or new competition nearby. The 6–10% range is not aggressive; it's necessary.
A percentage on its own is too abstract to plan around. The next section turns it into real dollar amounts you can actually budget.
Restaurant marketing budget benchmarks by revenue tier
Now put it in dollars. The table below shows your approximate monthly marketing budget by revenue band and spend rate.
Annual Revenue | 3% Spend | 5% Spend | 7% Spend |
|---|---|---|---|
$400,000 | $12,000/yr · $1,000/mo | $20,000/yr · $1,667/mo | $28,000/yr · $2,333/mo |
$600,000 | $18,000/yr · $1,500/mo | $30,000/yr · $2,500/mo | $42,000/yr · $3,500/mo |
$900,000 | $27,000/yr · $2,250/mo | $45,000/yr · $3,750/mo | $63,000/yr · $5,250/mo |
$1,200,000 | $36,000/yr · $3,000/mo | $60,000/yr · $5,000/mo | $84,000/yr · $7,000/mo |
$2,000,000+ | $60,000/yr · $5,000/mo | $100,000/yr · $8,333/mo | $140,000/yr · $11,667/mo |
Calculate from gross revenue (your top-line sales, before costs). This trips up a lot of small operators who accidentally calculate from net profit and end up with a budget that's too small to work.
Anchor example: A fast-casual doing $600K/year at 4% equals $24,000/year, or $2,000/month. That's a concrete, plannable number. It tells you exactly what you can afford to put into email, paid social, and delivery app promotions each month before you talk to a single agency.
Ghost kitchen and virtual brand note: With no physical storefront, digital marketing is your only visibility. There is no walk-by traffic to subsidize virtual brand awareness. Ghost kitchens already operate on startup costs 30–50% lower than traditional restaurants (NewMarketPitch), so redirect that capital advantage toward marketing. Plan toward the 5–7% end of the range, concentrated entirely in digital channels.
Multi-location independents: Calculate budgets per location first. Shared photo assets and ad creative reduce per-unit costs as you scale, so the effective rate can drop slightly. But don't cut the per-location budget before you've confirmed the shared assets are performing.

Set your goal before you set your budget
Budget size is meaningless without a target. New customer acquisition, repeat visit frequency, and delivery order volume each require different channels and different spend levels. Picking a number before picking a goal almost guarantees waste.
Three common marketing goals for independent and QSR operators, each aimed at a different target market and set of target customers:
- Drive first-time visits from nearby customers: primary metric is cost per new cover or new loyalty sign-up.
- Bring existing regulars back more often: primary metric is repeat visit rate or email-to-order conversion.
- Grow delivery or online order revenue: primary metric is promo redemption rate and order volume lift during campaign windows.
The most expensive mistake is mismatching goal and channel. Running brand awareness spend (paid social, influencer content) when your real problem is that regulars are drifting is a costly misdiagnosis. Spending on new customer acquisition when your repeat visit rate is already low means you're filling a leaky bucket.
Define one primary goal per quarter. That's what lets you draw a straight line between ad spend and actual people through the door.
The marketing spending ladder: what to fund first
Instead of listing eight channels and saying "pick what fits," this framework stacks priorities by budget size. Fund each level before moving to the next.
Level 1: free (non-negotiable at any budget)
- Complete and active Google Business Profile: include photos, menu, hours, Q&A, and review responses.
- Accurate listings on every delivery app you use, plus Yelp, your own restaurant website, and other local directories.
- Consistent review responses across Google, Yelp, and TripAdvisor, positive and negative.
Running paid ads while your Google Business Profile is incomplete is building on a broken foundation. Always fix this first.
Level 2: ~$500/month
- Email or SMS marketing to your existing customer list, the highest-ROI channel for customer retention, because you're reaching people who already know you.
- 1–2 boosted social posts per month tied to a specific offer, alongside consistent organic posting.
- A basic delivery app promotion.
At this tier, the biggest challenge is managing delivery app promotions without burning hours logging into multiple platforms. Otter's Marketing product automates delivery app promotions, so you can run targeted offers across platforms without the manual overhead and compare channel performance to see what's actually converting.
For more ways to make this tier work harder, explore how restaurants are using Otter's Marketing tools.
Level 3: $1,000–$1,500/month
- Paid social ads (Meta/Instagram): also called social media ads, with a specific, time-limited offer.
- Local SEO content backed by a small budget for search engine ads (Google Ads): a neighborhood-focused landing page targeting your area, supported by paid advertising on branded searches.
- Upgrade from a paper punch card to a digital loyalty program: build customer loyalty and lifetime value from your existing base.
The owner of Bangkok BBQ Bowl in West LA made exactly this switch: "We used to use a paper loyalty card, but now customers can use digital. They seem happy, and they come back more. They enjoy the points and the rewards."
Level 4: $2,000+/month
- Influencer or user-generated content seeding.
- Paid retargeting ads targeting visitors to your online ordering page who didn't complete an order.
- Catering-focused campaigns.
- Outsource marketing operations: multi-channel coordination, local public relations, and a part-time marketing manager or freelancer.
Key warning: A $300/month budget split across five channels will fracture the system. Concentrate before you diversify.
How to split your budget across channels
A 70–80% digital, 20–30% local/community split fits most QSR and fast-casual operators in competitive U.S. markets. That balance is the backbone of your restaurant marketing channels, and it is the marketing mix most independents can sustain.
Suggested split for a fast-casual with $2,000/month:
- ~$600: email/SMS and loyalty tools.
- ~$700: paid social (Meta/Instagram) and social media marketing.
- ~$400: delivery app promotions.
- ~$300: local SEO content or directory listings.
QSR and counter-service: Weight more toward delivery app promotions and Google. Your customers are searching on-demand and deciding in under 90 seconds. They're not browsing Instagram for dinner inspiration.
Ghost kitchen / virtual brand: Nearly 100% digital. Delivery app visibility, SEO for your brand name, and paid social with a direct ordering CTA are the channels that matter. Community events and local mailers are not relevant here.
Local and community spend still earns its place for brick-and-mortar operators: neighborhood event sponsorships, grand-opening mailers, direct mail flyers, and seasonal door-hangers can drive foot traffic efficiently in a tight radius. Make them trackable with a promo code or a dedicated URL.
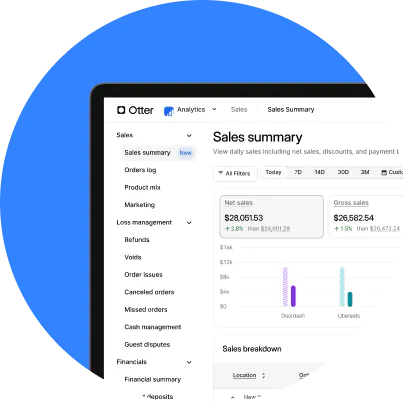
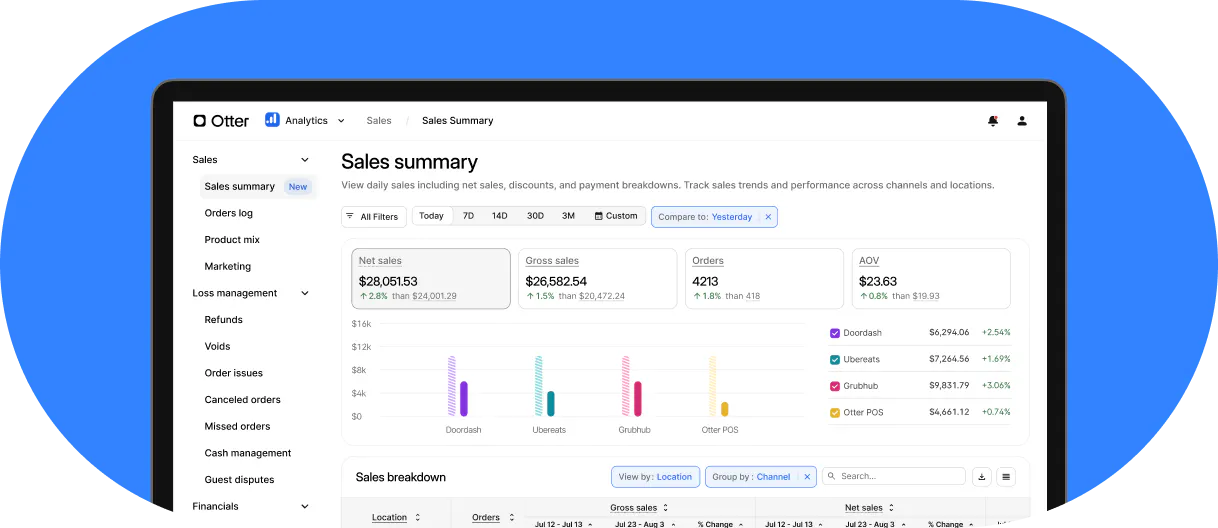
Otter's Analytics shows order volume by delivery channel, so you can see which platform drives the most revenue and weight your promotion budget accordingly, rather than splitting spend evenly across platforms that aren't performing equally.
Use your own sales data to decide where to spend
Most operators set marketing budgets by guessing at a percentage and picking channels by instinct. The better method is to let your own sales data drive the allocation, the same principle behind using Otter Analytics to make data-driven restaurant decisions.
Three data points to pull before finalizing your budget:
- Slow dayparts: where demand generation helps most.
- Average ticket trend: if it's flat or declining, a loyalty or upsell push pays off faster than new-customer acquisition.
- New vs. repeat customers split: if new customers are low, you need awareness spend; if repeat is low, you need retention spend.
Your new vs. repeat customers ratio is one of the clearest signals for where to focus your marketing ROI, or return on investment. If 70% of your orders come from the same regulars, your return on new-customer acquisition campaigns will be low until you've locked in retention first. Flip that: if you're seeing mostly first-time orders with low return rates, your lifetime value per customer is suffering, and a loyalty program will outperform any paid ad.
If 40% of your orders come through delivery apps, those channels deserve a proportional share of your promotion budget, not a generic equal split across platforms.
Otter's Analytics surfaces daypart trends, per-channel order volume, and average ticket data. You can use this to match marketing spend to where the revenue opportunity actually exists, rather than following generic industry advice.
Practical example: Your POS data shows Tuesday lunch is your weakest daypart. A geo-targeted Instagram ad running Tuesday 10am to 12pm with a specific offer ("$2 off any combo, today only") is smarter than a blanket weekly budget burning spend on your already-busy Friday dinner. That's how social media marketing pays off: targeted, measurable, tied to a real gap in your sales data.

How to track whether your marketing is actually working
"The ads look great, clicks are fine, but I can't draw a straight line between ad spend and actual people walking through the door." That's the number-one frustration in independent restaurant communities. The fix is to tie every dollar to a measurable outcome.
Define one primary metric per goal before you spend a dollar:
- New acquisition: cost per new cover or new loyalty sign-up.
- Retention: repeat visit rate or email open-to-order rate.
- Delivery growth: promo redemption rate and order volume lift during the campaign window.
By channel:
- Google Business Profile: Track profile views, direction requests, and call clicks. It's free, takes five minutes to check, and is one of the clearest signals that local awareness is improving.
- Email and SMS: Open rate and click-to-order rate are the baseline for your email campaigns. If your tool can't show orders attributed to a specific send, you need a better tool.
- Delivery app dashboards: Most platforms show impression-to-order rate for promoted listings. Otter's Marketing product consolidates performance across multiple delivery platforms so you're not logging into five separate dashboards to understand what's working.
- Paid social: Don't optimize for clicks or impressions. Optimize for offer redemptions or online orders. If your platform can't track that, use a unique promo code in every ad to measure offline attribution.
Cadence: Review spend vs. results every month, not every quarter. At razor-thin margins, a quarter of wasted spend is not recoverable.
Restaurant marketing budget mistakes that cost real money
- Spreading a small budget too thin: $500/month divided across Meta, Google, email, delivery apps, and TikTok means nothing works. Concentration beats diversification at low budgets.
- Running ads without a specific offer: "Come visit us!" is not a marketing message. "Free drink with any $15 order, this weekend only" is. Offers drive promo redemption rates; redemptions are trackable; trackable results justify the spend.
- Chasing new customers while existing ones disappear: Repeat customers carry higher lifetime value and lower acquisition costs. Email marketing and loyalty programs are systematically underfunded by independent operators too focused on top-of-funnel spend.
- Skipping free tools while running paid ads: Many operators invest in Meta campaigns while their Google Business Profile is incomplete, their menu photos are outdated, and they haven't responded to a review in two months. Fix the free layer first.
- Setting and forgetting: Launching a promotion and not checking results for 90 days. Monthly check-ins are not optional.
- Hiring an agency before you have a clear goal: Agencies need direction. Without a defined target (new covers, delivery order growth, catering leads), you'll receive content calendars and engagement reports, not results.
Precise targeting beats a bigger budget every time
The 3–6% rule is a starting point. Your actual marketing spend percentage is built from your revenue tier, your stated goal, your channel performance history, and your own sales data, in that order.
If you know your slowest daypart, your new vs. repeat customers ratio, and your highest-converting channel, you can allocate $1,000/month more effectively than a competitor spending $3,000 on instinct and industry benchmarks. That's what strong marketing ROI actually looks like: not the biggest budget, but the most precisely aimed one.
Do these four things:
- Set a percentage from the benchmarks that fits your revenue and stage.
- Pick one goal per quarter.
- Fund the spending ladder in order, starting with free tools.
- Pull your POS data monthly and reallocate toward what is converting.
Marketing is not a cost to minimize. It's a growth lever that compounds when you fund it consistently, run your marketing campaigns with discipline, and measure results honestly. Operators who treat it like a bill to cut are the same ones wondering why the new place down the block is packed every Friday.
Ready to build a marketing budget backed by your own sales data? Otter gives you both the sales analytics and the marketing tools in the same POS.
Frequently asked questions about restaurant marketing budgets
How much should a restaurant spend on marketing?
A common industry benchmark puts established restaurants at 3–6% of gross annual revenue, with newer restaurants closer to 6–10% while they build a customer base. Run the math on your own top line first: at $600,000 a year, a 4% budget works out to roughly $2,000 a month. Treat that figure as your baseline and adjust upward if you're chasing aggressive growth.
What should be included in a restaurant marketing budget?
Plan for three buckets. First, paid media such as social ads and delivery app promotions. Second, the software that runs your campaigns, like an email or SMS platform and a loyalty program. Third, a cushion for costs that sneak up on operators, including photography, content, freelancer or agency fees, and the kitchen cost of any promotional item. A 15–20% cushion on top of media spend keeps those surprises from breaking your plan.
Which marketing channels work best for independent restaurants?
A complete Google Business Profile does the most work for the least money, followed by email or SMS to your regulars, paid social on Meta or Instagram, delivery app promotions, and local SEO. There is no universal best channel, though. The right one depends on whether your priority is winning new customers, lifting repeat visits, or growing delivery orders, so match the channel to the goal before you commit a dollar.
How do I measure restaurant marketing ROI?
Attach one number to each goal before spending: cost per new cover for acquisition, repeat visit rate for retention, and promo redemptions or order lift for delivery growth. Check those numbers monthly rather than quarterly, so a channel that isn't converting can be cut before it drains a full season's budget. Consistent measurement is what turns marketing spend into a return on investment you can actually see.
How much should a new restaurant spend on marketing?
A restaurant in its first year usually needs the higher end of the range, around 6–10% of projected gross revenue, to build awareness from a standing start. On $500,000 of projected year-one sales, that lands somewhere between roughly $2,500 and $4,200 a month. Hold that rate for the first 6 to 12 months, then ease toward the 3–5% maintenance level once regulars are established.
Should a ghost kitchen or virtual brand budget more for marketing?
Yes. Without a storefront, a ghost kitchen or virtual brand has no walk-by traffic, so paid and organic visibility online is the entire game. Delivery commissions and thin margins make earned reach through promotions and social even more valuable. A target of 5–7% or higher, concentrated in delivery app promotions, paid social with a direct ordering link, and SEO for the brand name, is reasonable for operators with no foot traffic.
What is the biggest restaurant marketing budget mistake?
Spreading too little money across too many channels, so none of them registers anywhere. A $500 monthly budget split among Meta, Google, email, delivery apps, and TikTok buys invisibility on all five. Pick one or two channels you can fund properly, prove they convert, and only then add a third.

Build your marketing budget with Otter