Table of contents
- What POS reporting actually means for your restaurant
- The 5 POS reports worth checking every single week
- 1. Sales summary report: how to read past the top-line total
- 2. Product mix report: finding what's making money and what's wasting it
- 3. Labor report: matching staffing to sales, shift by shift
- 4. Void and discount report: the quiet signal most owners miss
- 5. Channel and daypart breakdown: the report you're probably skipping
- Other POS reports worth knowing beyond the weekly five
- How to build a realistic weekly reporting routine
- Thirty minutes a week is the cheapest operations upgrade available to you
- Frequently asked questions about POS reporting
You already know yesterday's sales number. You checked it this morning, felt something about it, and moved on. That is how most independent operators use their POS, and it is leaving real money on the table.
According to the National Restaurant Association, food and labor together consume roughly 60 to 65 cents of every revenue dollar. At those margins, a single undetected pattern, a void spike, a dragging menu item, an overstaffed daypart, compounds into meaningful losses faster than you would expect. The sales data to catch it is already sitting in your POS. The question is whether you are pulling it.
These are the five POS reports worth checking every week: how to read each one, what action each one should trigger, and how to build a realistic weekly routine around all five in about 30 minutes. The goal is not more numbers, it is actionable insights that protect your profit margins.
Key insights
- Your top-line total sales number hides more than it reveals. Net sales broken down by daypart and order channel is where real business decisions actually start.
- The void and discount report is the closest thing an independent restaurant has to a loss-prevention team: pull it weekly and investigate any employee whose void rate runs 2 to 3x higher than peers over consecutive shifts.
- Sales-per-labor-hour is the single metric that directly connects your schedule to your P&L. Use last week's numbers by shift and daypart to build next week's schedule instead of going off memory.
- Your point of sale system records all of this on every transaction. Reviewing five reports takes 30 minutes per week and replaces the guesswork that erodes margins across staffing, menu, and channel mix simultaneously.
What POS reporting actually means for your restaurant
POS reports are not accounting records. Your bookkeeper needs the numbers, and they should flow cleanly into your accounting software, but that is not why these reports matter to you as an operator. For the bookkeeping side of the picture, see our guide to restaurant accounting.
Every transaction your system records captures the item sold, the quantity, the payment method, the staff ID, the time, and any discounts or voids applied. POS reporting is the process of surfacing that data in a readable format so you can act on it. Think of it as real-time transaction logs turned into clear sales reports, sales trends, labor patterns, and channel performance you can read in one sitting. Good POS analytics turn raw records into decisions.
The operators who treat these reports as operational controls, not paperwork, run a different business than those who do not. They make scheduling decisions based on last week's numbers, not last month's memory. They catch discount anomalies before they become HR conversations. They pull underperforming menu items before those items quietly drain food costs for another quarter.
Here is the reality for most independent owners: there is no analytics team, no regional VP reviewing dashboards, no corporate loss-prevention function. You are the analyst. That means reports need to be readable, fast, and tied to a specific decision.
Daily review is reactive. By the time you are looking at today's data, you are already in the middle of the problem. Monthly review is too slow: a pattern that runs unchecked for four weeks costs roughly four times as much as catching it at week one. Weekly is the cadence where patterns become visible before they become losses.
The 5 POS reports worth checking every single week
These five reports cover five different operational levers:
- Sales summary: revenue integrity
- Product mix (PMIX): menu performance
- Labor: people efficiency
- Void and discount: loss prevention
- Channel and daypart breakdown: channel mix and margin by revenue stream
Miss one and you have a blind spot. A strong sales week can hide a void problem. A healthy labor cost percentage can mask an overstaffed Friday dinner. Your PMIX can look fine in aggregate while one high-cost item quietly bleeds margin.
Most POS systems generate all five automatically. Your job is not to build them, it is to pull them and ask the right question of each one.
Otter's analytics surface all five in a single dashboard across every ordering channel: dine-in, online ordering, and kiosk. Multi-channel reporting is built in, so you are not manually reconciling numbers from three separate places before you can even start reading them.
“Otter Analytics is really great. Really easy to use. How we're doing day by day, week by week, month by month. It's really kind of easy to see everything in one place and also be looking at what's selling best.”
Austin, owner of Pokitomik

1. Sales summary report: how to read past the top-line total
What it is
The sales summary report shows every dollar rung up in a given period, broken down by gross sales, adjustments, and net sales.
Why it works
Gross sales is everything rung up before adjustments. Net sales is gross minus voids, discounts, and refunds, the number that actually hits your account. Track net, not gross. A strong gross sales week can mask real revenue leakage if discounting or voids are running high.
The most useful move you can make with this report is a period-over-period comparison: this week versus last week, and the same week last year. Seasonal context matters enormously. A 12% dip in the third week of January looks very different if last January looked identical.
Watching sales trends week over week is how you separate signal from noise. One bad Tuesday is weather. Three bad Tuesdays in a row is a scheduling, traffic, or operational problem worth investigating.
What to look for:
- A dip on the same day of the week, repeated across three or more weeks. That is a pattern, not weather.
- Cash vs. credit card breakdown: a sudden shift in cash transactions can be an early loss signal worth cross-referencing against your void and discount report.
- If net sales drop more than 10% week-over-week with no external cause (holiday, local event, weather), pull the PMIX and void reports before assuming it is a traffic problem.
Quick tip
Never celebrate a strong gross sales week without checking net. Aggressive discounting or high voids can make gross look fine while net quietly erodes.
2. Product mix report: finding what's making money and what's wasting it
What it is
The product mix report (PMIX) shows every menu item sold in a given period, ranked by quantity and revenue contribution. This is the report that tells you what is actually on your customers' plates.
Why it works
Run the top-10/bottom-10 exercise every week. Flag any item in the bottom 10 that also carries a high food cost. Low volume plus high ingredient cost is a margin drain with no upside.
A simple four-quadrant framework helps you categorize what you find:
- Stars: high popularity, high margin. Protect these and make sure they are easy to find on your menu.
- Plowhorses: high popularity, low margin. Candidates for repricing or recipe engineering.
- Puzzles: low popularity, high margin. Worth promoting or repositioning before cutting.
- Dogs: low on both. Remove or replace.
PMIX also connects directly to your purchasing decisions and inventory management. Your top-selling items drive your ingredient orders. If you do not know what is moving, you are guessing on quantities, which means either waste or stockouts, and both cost money. Watching these sales trends over time also helps you plan orders more accurately and protect cash flow by avoiding over-purchasing slow movers.
For ghost kitchen and virtual brand operators, PMIX by brand tells you which virtual brand menu is pulling its weight and which is diluting your kitchen's focus without proportional revenue.
Quick tip
Three consecutive weeks in the bottom 10 earns a menu conversation, not necessarily a cut, but a pricing, placement, or description review. One week can be noise. Three weeks is signal.
3. Labor report: matching staffing to sales, shift by shift
What it is
The labor report shows total hours worked by shift, day, and employee, alongside the sales generated during those same periods.
Why it works
The key metric here is sales-per-labor-hour (SPLH): divide net sales by total labor hours for a shift or day. Fast-casual benchmarks typically run $30 to $50 SPLH depending on concept and market. Find your own baseline first, then track movement against it week over week.
If your Saturday dinner SPLH runs well below your Monday lunch SPLH, you are overstaffed on your highest-volume shift, which is the most expensive place to be overstaffed.
There are two failure modes, and both cost money:
- Overstaffing slow periods erodes labor cost as a percentage of net sales.
- Understaffing rushes slows tickets, loses covers, and reduces per-shift revenue.
The labor report surfaces both. It also gives you an individual staff view: which team members generate the highest average ticket across their shifts is useful context for scheduling, not about cutting people, but about putting your strongest staff on your highest-stakes shifts. That employee performance lens is why many operators also pull an employee sales report.
Quick tip
Use last week's SPLH by daypart to set next week's schedule. If Tuesday lunch consistently runs below your SPLH target, that is a schedule reduction conversation, not a marketing problem. Cross-reference with ticket time data or customer feedback before making staffing changes based solely on the labor report. SPLH alone does not capture service quality.
4. Void and discount report: the quiet signal most owners miss
What it is
Every order voided after entry, every discount applied, every manager override, and every comped item, all with a staff ID and timestamp attached. Your POS logs all of it. Whether you look at it is your choice.
Why it works
For an independent restaurant without a corporate loss-prevention team, this report is your loss-prevention function. No one else is watching this data.
Specific patterns to investigate:
- One employee's shifts showing a void rate 2 to 3x higher than peers
- Discounts applied without a manager code
- Comps spiking on closing shifts or weekend nights when you are not present
- A staff-meal discount appearing on non-staff items or outside approved windows
Working threshold: Anything above 2 to 3% of total transactions being voided is worth a manual review. A single team member consistently above this rate warrants a direct conversation, not an immediate assumption of wrongdoing, but it needs to be addressed before it becomes a P&L line item.
This is the formal concept behind POS exception reporting: flagging transactions that fall outside normal parameters. Some POS systems generate exception alerts automatically. Others require you to pull the void and discount report manually and look for patterns yourself. Know which yours does, and if it is manual, make it a non-negotiable weekly pull.
Quick tip
Pull this report weekly, compare by employee, flag patterns three weeks in a row, and address at the management level before the pattern escalates.
5. Channel and daypart breakdown: the report you're probably skipping
What it is
A breakdown of net sales by fulfillment channel (dine-in, online ordering, third-party delivery, kiosk) and by daypart (morning, lunch, dinner, late-night).
Why it works
Your sales summary can mislead you. $9,000 in Tuesday net sales looks identical whether it came from lunch dine-in or dinner online ordering, but the operational story, cost structure, and margin are completely different.
Daypart analysis tells you where your volume actually lives. If lunch is your highest-volume daypart but carries your lowest average ticket, that is a menu design or upsell problem, not a traffic problem. The fix is different, and so is the cost.
Channel analysis goes further. In-store, online ordering, third-party delivery, and kiosk each carry a different cost structure. A delivery channel generating 30% of your gross revenue might contribute far less to your cash flow once you account for a 20 to 30% platform commission. Average ticket by channel is the granular number that tells the real story.
If your delivery average ticket is shrinking week-over-week, that signals a pricing issue on the delivery-specific menu, a drop in add-on attachment, or a key bundle item that got removed. You will not see that in your sales summary. This is exactly the kind of business decision that multi-channel reporting makes possible, and that gut feel gets wrong.
For ghost kitchen and virtual brand operators, this is the report that determines brand viability. If Brand A generates 70% of your delivery revenue using the same kitchen and labor as Brand B, that is a consolidation conversation worth having now.
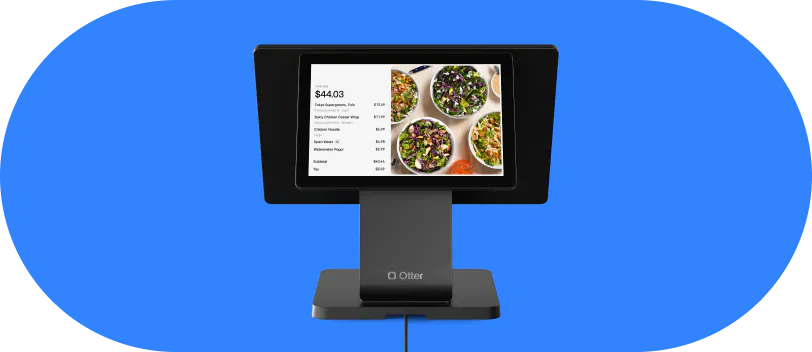
Because Otter POS consolidates orders from dine-in, online ordering, and kiosk into one reporting environment, channel-level analysis does not require reconciling three separate systems. The breakdown is already in one place.
Quick tip
Set a weekly channel-mix baseline in your first month of running this report. If any channel's share shifts more than 5 percentage points in a given week, investigate before the drift compounds into a structural problem.
Other POS reports worth knowing beyond the weekly five
The five above are the weekly core. Depending on your point of sale system, your POS analytics may include other point of sale reports worth pulling when a specific question comes up:
- Inventory reports: stock levels and inventory levels by item, tying your reporting to inventory management and reorder timing.
- Customer reports: purchase history, customer insights, and customer behavior that feed a CRM, your loyalty programs, and future marketing campaigns.
- Employee reports: an employee sales report and employee performance view that goes deeper than the weekly labor report.
- Payment reports: a breakdown of payment methods, cash transactions, and cash drawer reports you can reconcile at close or export to accounting software.
Once your weekly reporting habit is in place, you can use the same data to answer bigger questions about menus, guests and sales channels. Otter’s restaurant POS analytics guide shows how to turn those patterns into decisions.

How to build a realistic weekly reporting routine
Daily (5 minutes, non-negotiable): End-of-day net sales and a quick scan of the void and discount report. If something looks off, you catch it the next morning instead of at month-end.
Weekly (Monday morning, 30 minutes): The full five-report pull: sales summary, PMIX, labor, void and discount, channel and daypart. Compare each to the prior week. Flag one thing per report that needs action.
Monthly (1 to 2 hours): Trend analysis across PMIX over 4 to 6 weeks, labor cost as a percentage of net sales month-over-month, and channel mix trending up or down. This is where pricing and menu engineering decisions get made.
Why weekly beats monthly: a menu item bleeding margin for four weeks costs roughly 4x as much as catching it at week one. A void pattern that runs unchecked for a month costs real money and creates a harder conversation with the team member involved.
Practical tip: Link the weekly review to something you already do. If you place ingredient orders Monday morning, add 30 minutes for reports before the order call. The PMIX will directly inform the order anyway, and keeping a close eye on stock levels for your top sellers prevents both waste and last-minute shortages that hurt cash flow.
If you run multiple locations: each GM should own their location's weekly report pull and flag anomalies to ownership within 24 hours. Standardize which five reports, same format, same day every week. Consistency is what makes patterns visible across locations.
Thirty minutes a week is the cheapest operations upgrade available to you
Your POS is already capturing every piece of data covered here, on every transaction, every shift, every channel. The reports exist. Reviewing them costs only 30 minutes per week.
The compounding math is straightforward: catching a $200 per week revenue leak at week one instead of month three is a $2,400 swing. Multiply that across an undetected void pattern, a dragging menu item, and an overstaffed daypart running simultaneously, and the stakes are significant for a thin-margin independent.
Operators who run these five reports weekly make scheduling decisions on last week's SPLH, not last month's memory. They pull underperforming menu items before those items erode food costs. They catch discount anomalies before they become HR issues. They know which order channel is actually contributing to cash flow and which is generating volume that costs more than it returns.
The goal is not more data. It is fewer business decisions made on gut feel. Replace guesswork with a 30-minute weekly routine, and your next scheduling call, menu review, and purchasing conversation all get sharper when they start with a report. Book a demo with Otter to see all five reports in one place.
Frequently asked questions about POS reporting
What is POS reporting?
POS reporting is the process of pulling and analyzing the transaction data your point of sale system captures on every order: items sold, quantities, payment type, staff ID, discounts applied, voids, and timestamps. It is not just an accounting record. It is an operational control tool that supports daily and weekly business decisions around staffing, menu performance, and revenue integrity.
What POS reports should restaurant owners check every week?
Five reports cover the full operational picture:
- Sales summary: answers “did revenue hold, and where did it come from?”
- Product mix (PMIX): answers “which menu items are earning their place?”
- Labor: answers “is my schedule aligned with my actual sales volume?”
- Void and discount: answers “is revenue leaving through the back door?”
- Channel and daypart breakdown: answers “which revenue streams are actually profitable?”
Each one covers a different lever. Miss one and you have a blind spot.
What is the difference between gross sales and net sales in a POS report?
Gross sales is the total value of everything rung up before any adjustments. Net sales is gross minus voids, discounts, and refunds, the number that reflects actual revenue. Track net. A strong gross number can mask real revenue leakage from aggressive discounting or high voids. If you are making decisions based on gross, you may be operating on a number that is more optimistic than what is actually hitting your account.
What is POS exception reporting?
Exception reporting flags transactions that fall outside normal parameters: unusually high void rates, discounts applied without manager authorization, or activity outside approved hours. Some POS systems generate exception alerts automatically. Others require you to pull the void and discount report manually and look for patterns yourself. For independent operators without a dedicated loss-prevention function, this is one of the most important reports to understand.
How do I use a POS report to control labor costs?
Start with sales-per-labor-hour (SPLH): divide net sales by total labor hours for a given shift or day. That number tells you how efficiently each labor dollar is generating revenue. Use the prior week's SPLH by daypart to build the following week's schedule. If Tuesday lunch consistently runs below your SPLH target, that is a scheduling adjustment. If Saturday dinner runs below target despite high volume, you may be overstaffed on your busiest shift. The labor report makes both patterns visible.
How often should I review POS reports?
Three cadences work together:
- Daily (5 minutes): end-of-day net sales and a void/discount scan
- Weekly (30 minutes on Monday): the full five-report set, compared to the prior week
- Monthly (1 to 2 hours): trend analysis across PMIX, labor cost as a percentage of sales, and channel mix
Weekly is the most operationally valuable cadence. It is frequent enough to catch patterns before they compound, and infrequent enough that you are looking at trends rather than noise.
What is a product mix report and how should I use it?
A PMIX report shows every menu item sold in a period, ranked by quantity and revenue contribution. Run the top-10/bottom-10 exercise weekly. Any item in the bottom 10 that also carries a high food cost is a pull-or-reprice candidate. Use the four-quadrant framework (stars, plowhorses, puzzles, dogs) to categorize items and decide whether to protect, reprice, promote, or remove them. Apply the three-consecutive-weeks rule: an item in the bottom 10 for three straight weeks earns a pricing or placement review.
Can POS reports help me manage a ghost kitchen or virtual brand?
Yes, specifically the channel and daypart breakdown and the PMIX by brand. The channel breakdown shows you revenue by fulfillment channel and brand. If one virtual brand generates a disproportionately small share of delivery revenue while consuming equal kitchen labor and capacity, that is a consolidation signal worth acting on. PMIX by brand shows which items within each virtual concept are driving or dragging performance.

See all your POS reports in one dashboard